Performs data driven smooth tests for simple hypothesis of uniformity on [0,1]. Embeding null model into the original exponential family introduced by Neyman (1937).
ddst.uniform.test(
  x,
  base = ddst.base.legendre,
  d.n = 10,
  c = 2.4,
  nr = 1e+05,
  compute.p = TRUE,
  alpha = 0.05,
  compute.cv = TRUE,
  ...
)
Arguments
| x | a (non-empty) numeric vector of data |
|---|---|
| base | a function which returns an orthonormal system, possible choice: |
| d.n | an integer specifying the maximum dimension considered, only for advanced users |
| c | a calibrating parameter in the penalty in the model selection rule |
| nr | an integer specifying the number of runs for a p-value and a critical value computation if any |
| compute.p | a logical value indicating whether to compute a p-value or not |
| alpha | a significance level |
| compute.cv | a logical value indicating whether to compute a critical value corresponding to the significance level alpha or not |
| ... | further arguments |
Value
An object of class htest
the value of the test statistic.
the number of choosen coordinates (k).
a character string indicating the parameters of performed test.
a character string giving the name(s) of the data.
the p-value for the test, computed only if compute.p=T.
References
Inglot, T., Ledwina, T. (2006). Towards data driven selection of a penalty function for data driven Neyman tests. Linear Algebra and its Appl. 417, 579--590.
Ledwina, T. (1994). Data driven version of Neyman's smooth test of fit. J. Amer. Statist. Assoc. 89 1000-1005.
Neyman, J. (1937). `Smooth test' for goodness of fit. Skand. Aktuarietidskr. 20, 149-199.
Examples
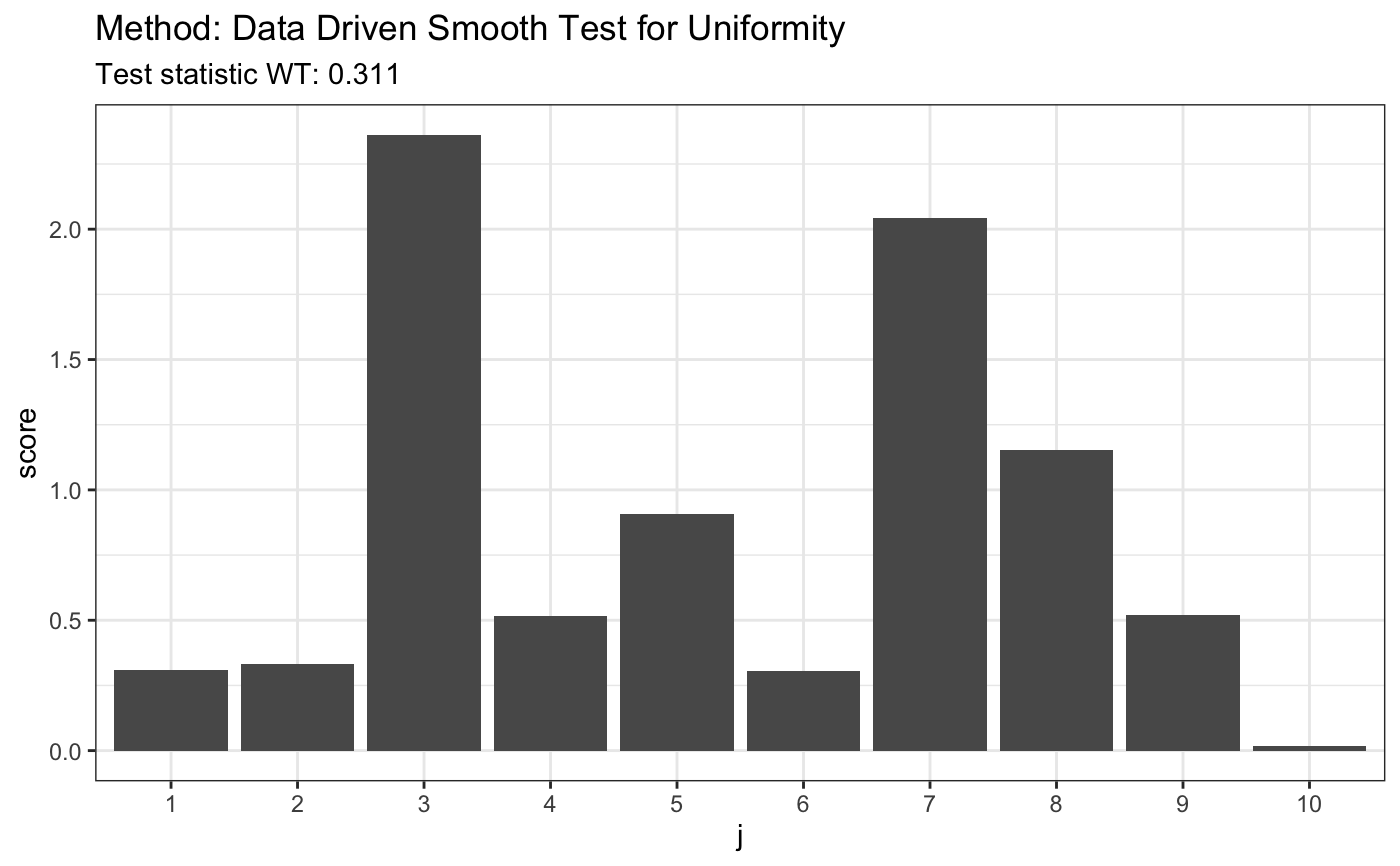
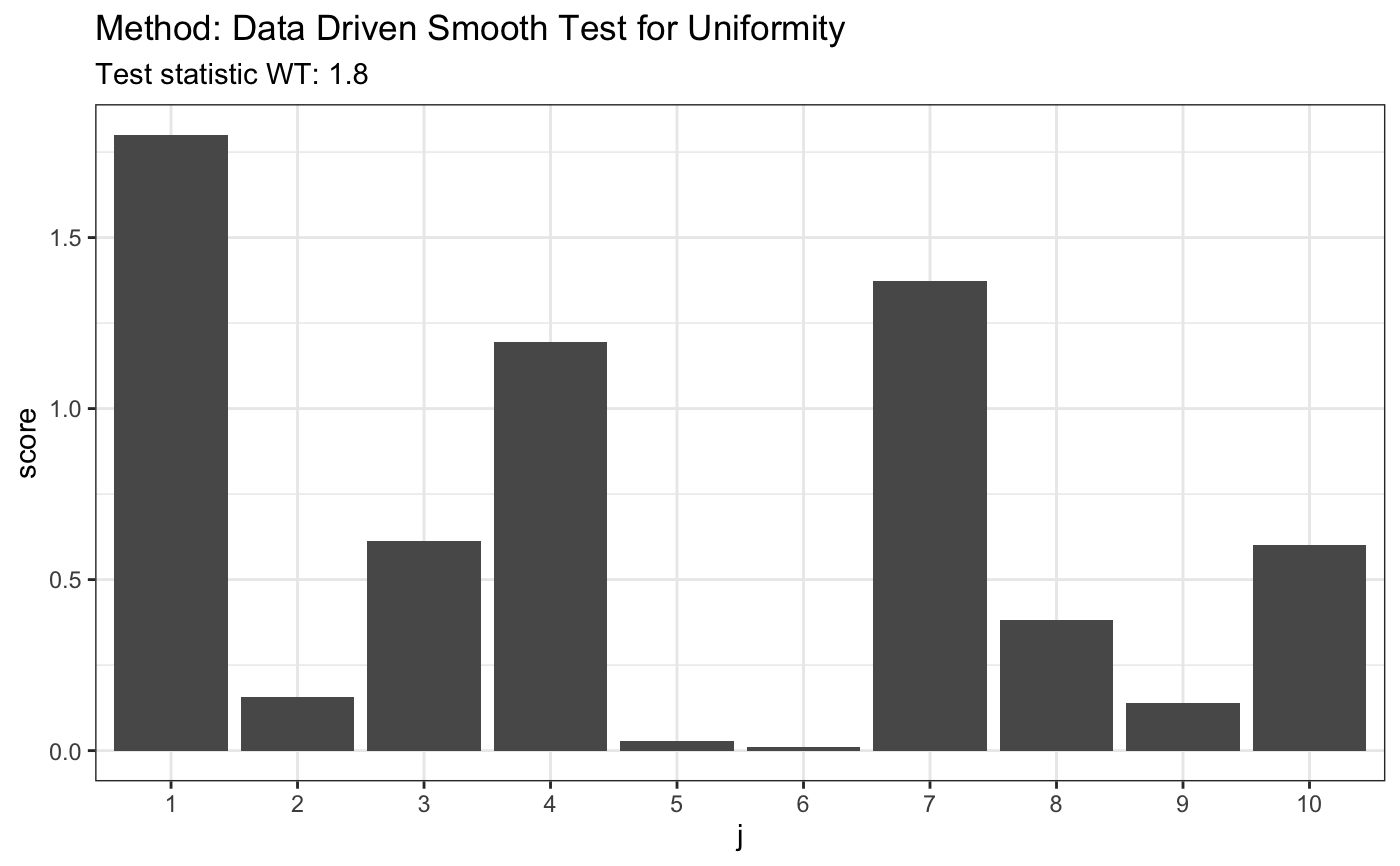
#> #> Data Driven Smooth Test for Uniformity #> #> data: z, base: ddst.base.legendre c: 2.4 d.n: 10 cv(0.05) : 0.0045668) #> WT = 0.31054, T = 1, p-value = 0.5989 #>plot(t)# known fixed alternative z <- rnorm(80,10,16) t <- ddst.uniform.test(pnorm(z, 10, 16), compute.p = TRUE, d.n = 10) t#> #> Data Driven Smooth Test for Uniformity #> #> data: pnormz1016, base: ddst.base.legendre c: 2.4 d.n: 10 cv(0.05) : 0.0041374) #> WT = 1.8002, T = 1, p-value = 0.2205 #>plot(t)#> #> Data Driven Smooth Test for Uniformity #> #> data: z, base: ddst.base.legendre c: 2.4 d.n: 10 cv(0.05) : 0.0043749) #> WT = 57.602, T = 4, p-value < 2.2e-16 #>t$p.value#> [1] 0plot(t)