What If Plots
Przemyslaw Biecek
2018-12-13
whatIf1d.RmdIntroduction
First, let’s create explainers for random Forest model and linear model
library("DALEX")
library("randomForest")
library("ceterisParibus")
set.seed(59)

apartments_lm_model <- lm(m2.price ~ construction.year + surface + floor +
                            no.rooms + district, data = apartments)

apartments_rf_model <- randomForest(m2.price ~ construction.year + surface + floor +
                                      no.rooms + district, data = apartments)

explainer_rf <- explain(apartments_rf_model,
                        data = apartmentsTest[,2:6], y = apartmentsTest$m2.price)
explainer_lm <- explain(apartments_lm_model,
                        data = apartmentsTest[,2:6], y = apartmentsTest$m2.price)
Ceteris Paribus Plots
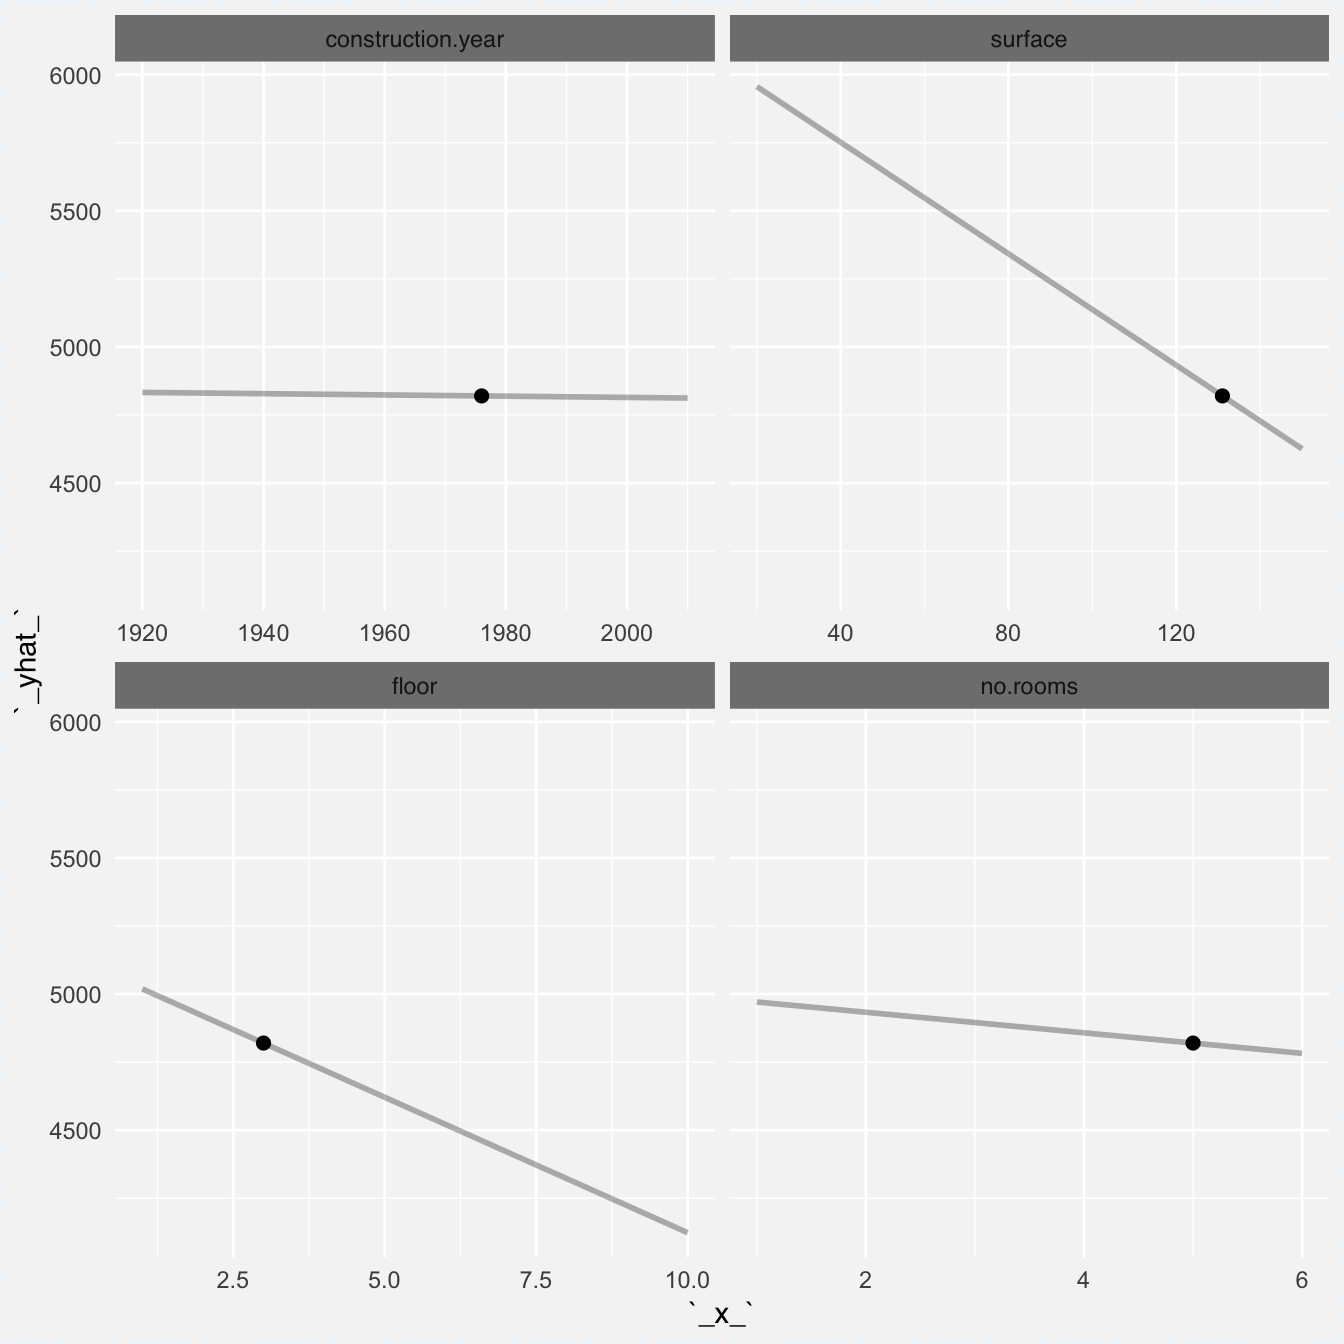
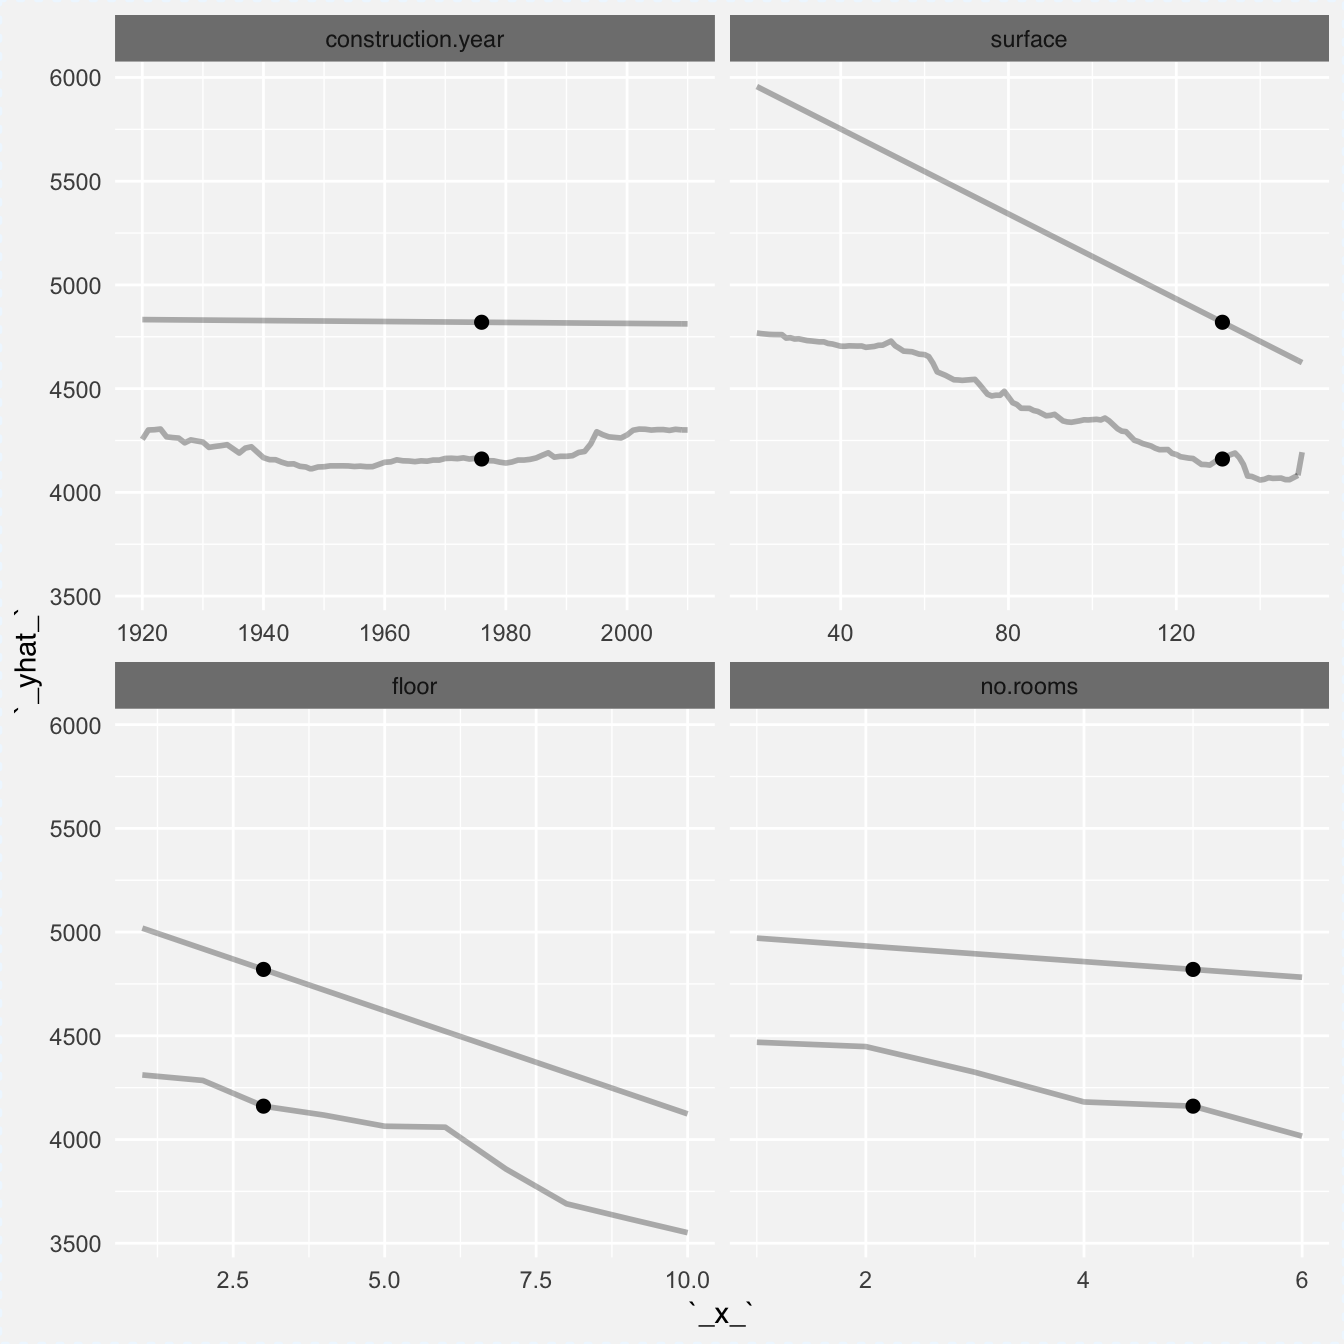
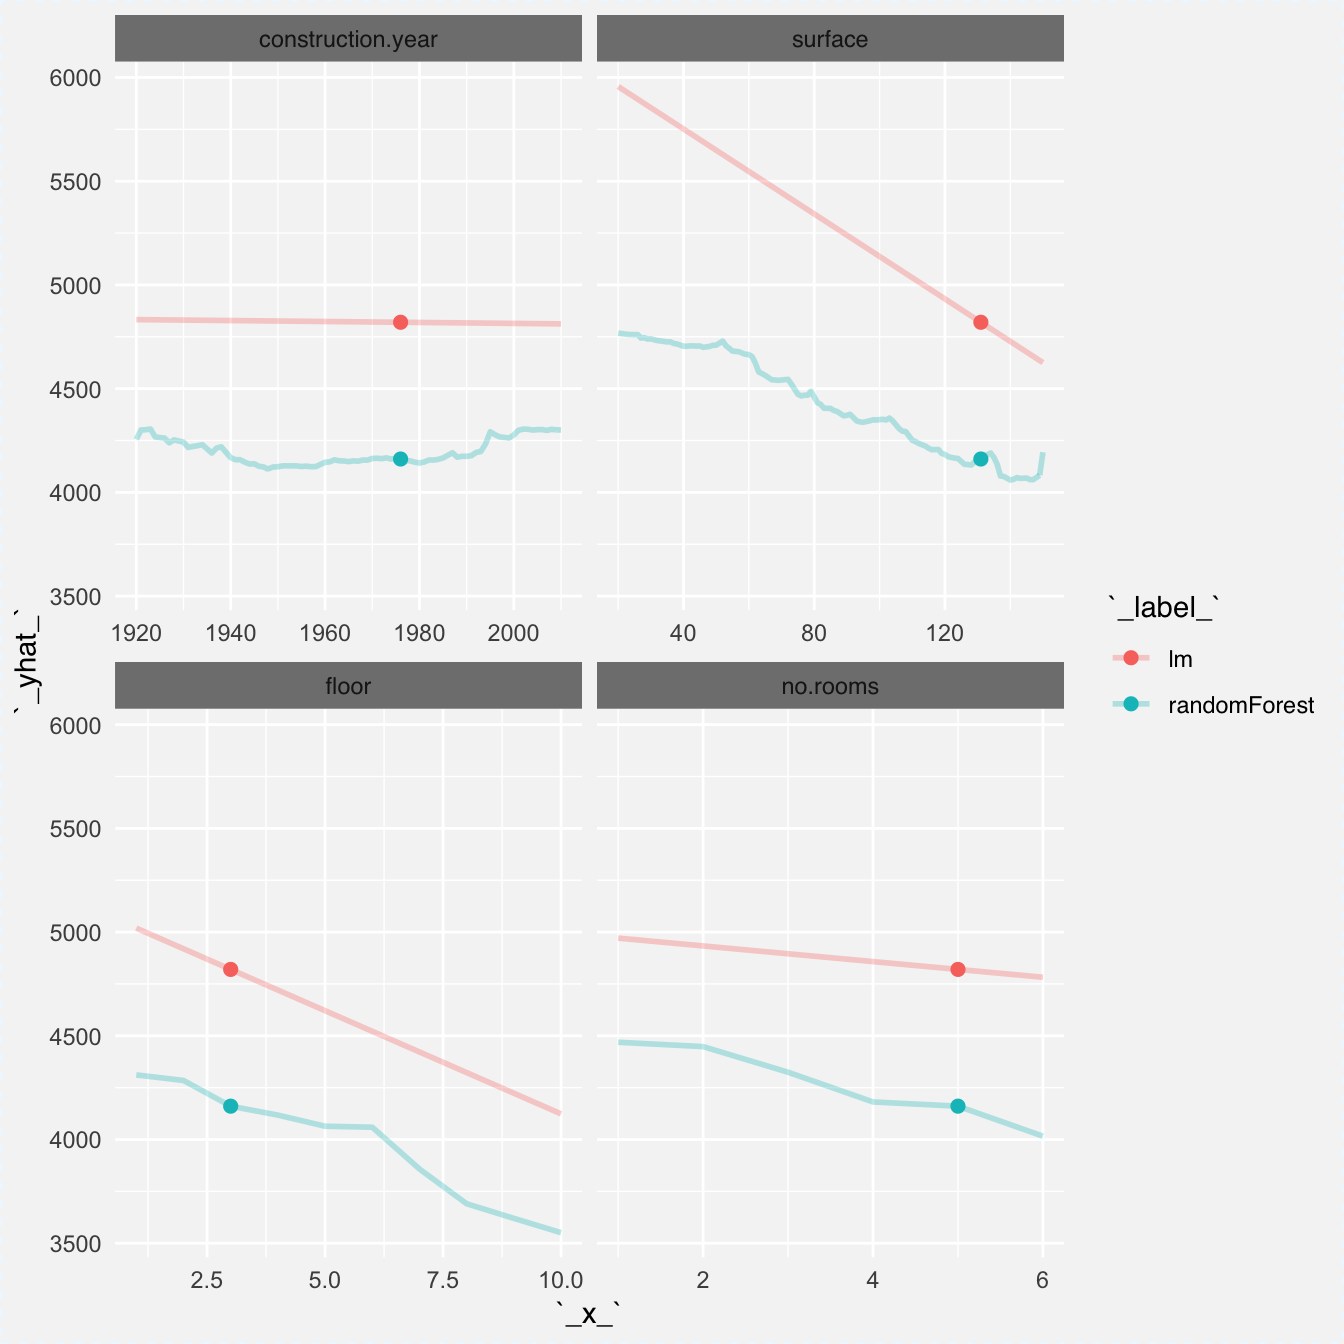
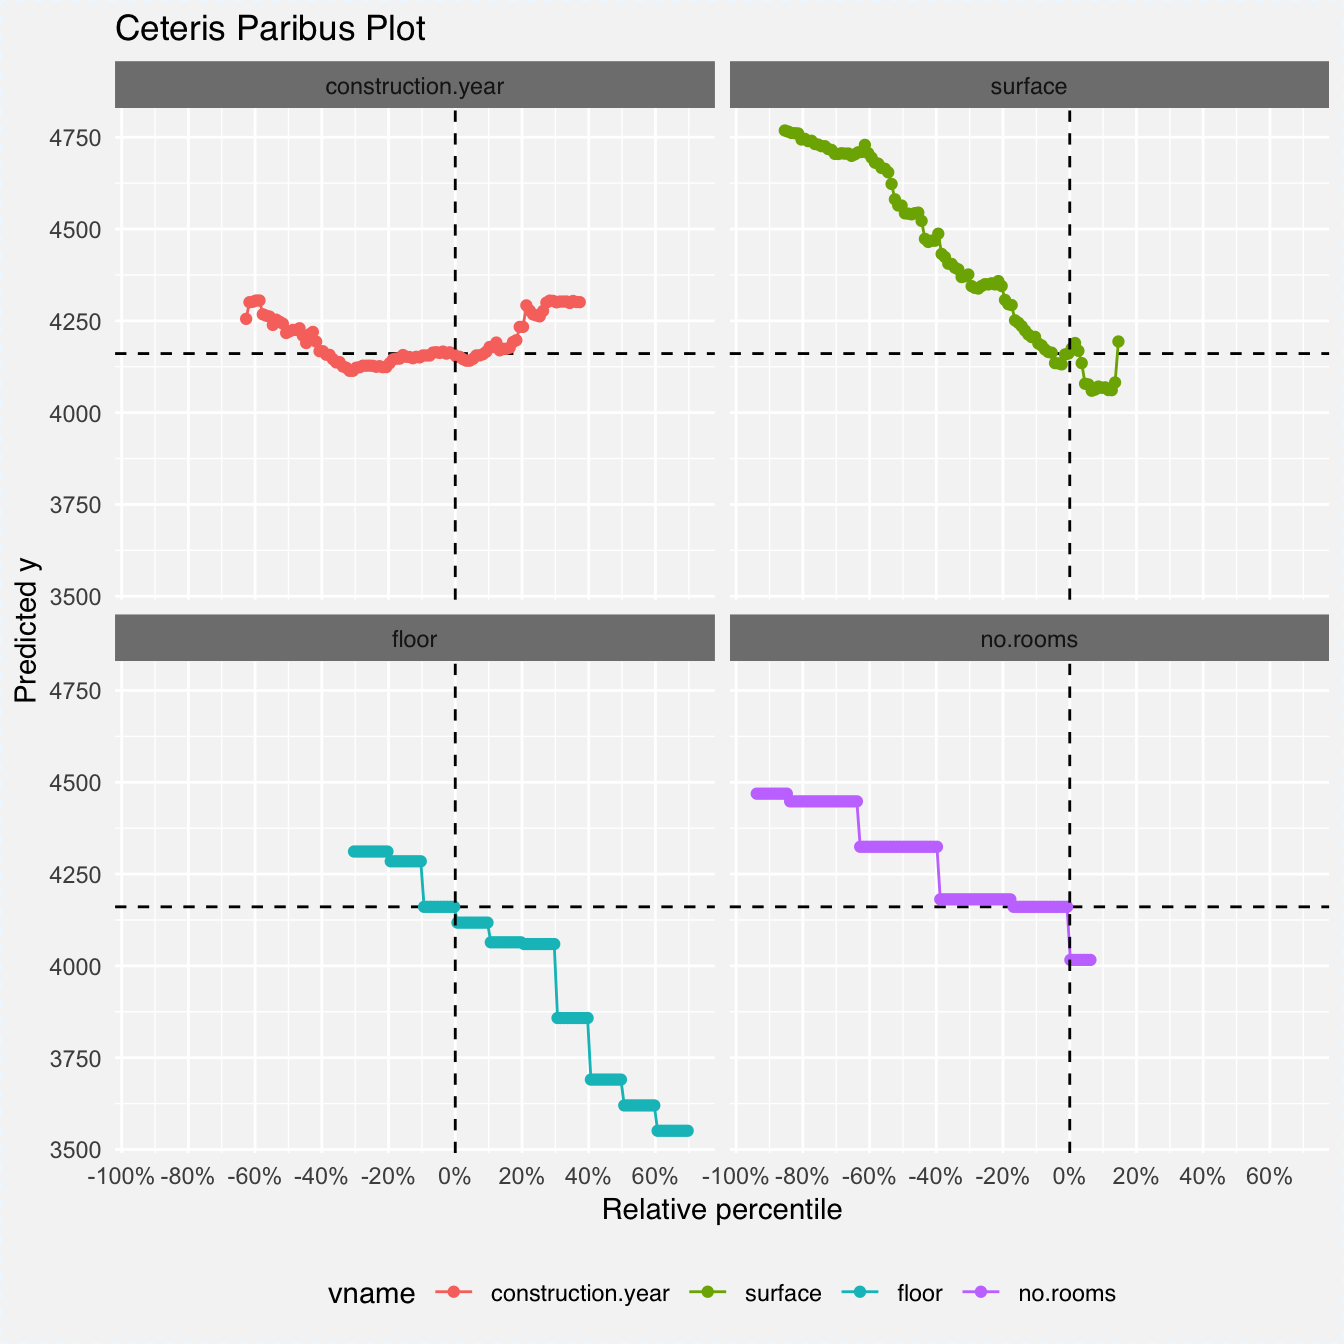
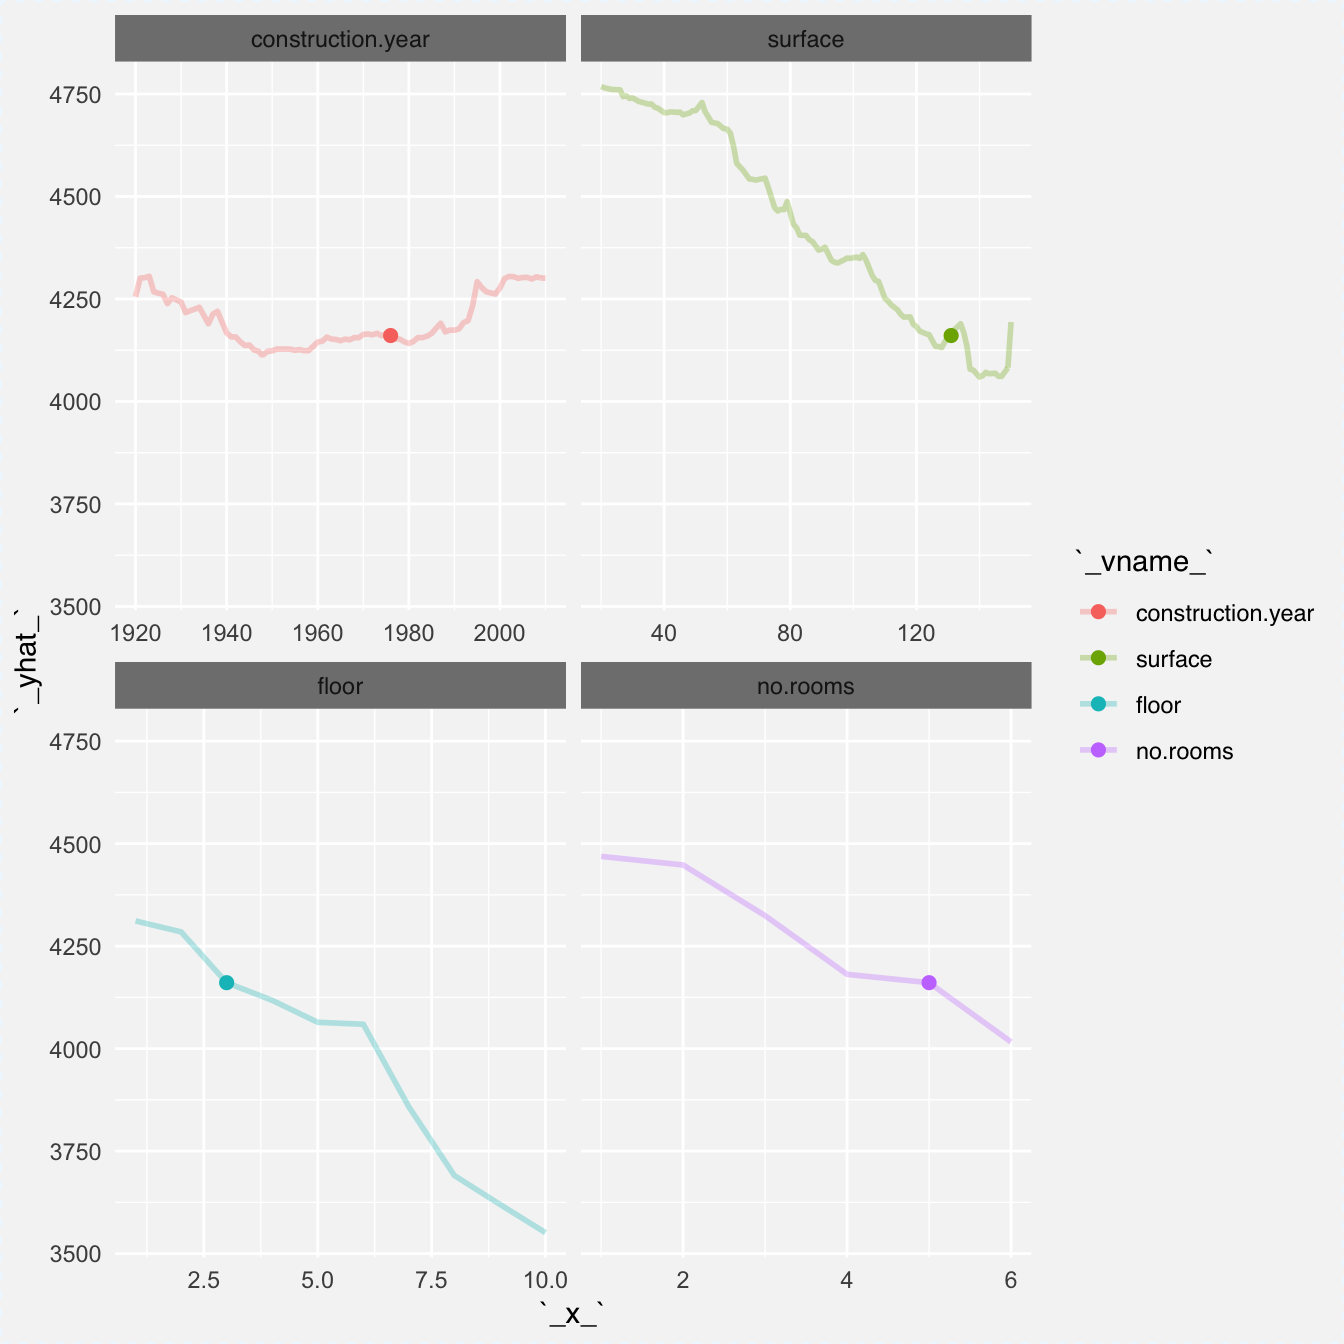
Please, note that there are two methods that create Ceteris Paribus Plots. The older solution is to use what_if() function. The new solution is to use ceteris_paribus() function. These functions have slightly different interfaces.
The old interface (what_if)
Here is the one with what_if().
##      m2.price construction.year surface floor no.rooms    district
## 1001 4644 1976 131 3 5 Srodmiescie## y_hat new_x vname x_quant quant relative_quant
## 1001 4255.354 1920 construction.year 0.6268889 0.00 -0.6268889
## 1001.1 4300.702 1921 construction.year 0.6268889 0.01 -0.6168889
## 1001.2 4301.926 1922 construction.year 0.6268889 0.02 -0.6068889
## 1001.3 4305.352 1923 construction.year 0.6268889 0.03 -0.5968889
## 1001.4 4305.352 1923 construction.year 0.6268889 0.04 -0.5868889
## 1001.5 4267.723 1924 construction.year 0.6268889 0.05 -0.5768889
## label
## 1001 randomForest
## 1001.1 randomForest
## 1001.2 randomForest
## 1001.3 randomForest
## 1001.4 randomForest
## 1001.5 randomForest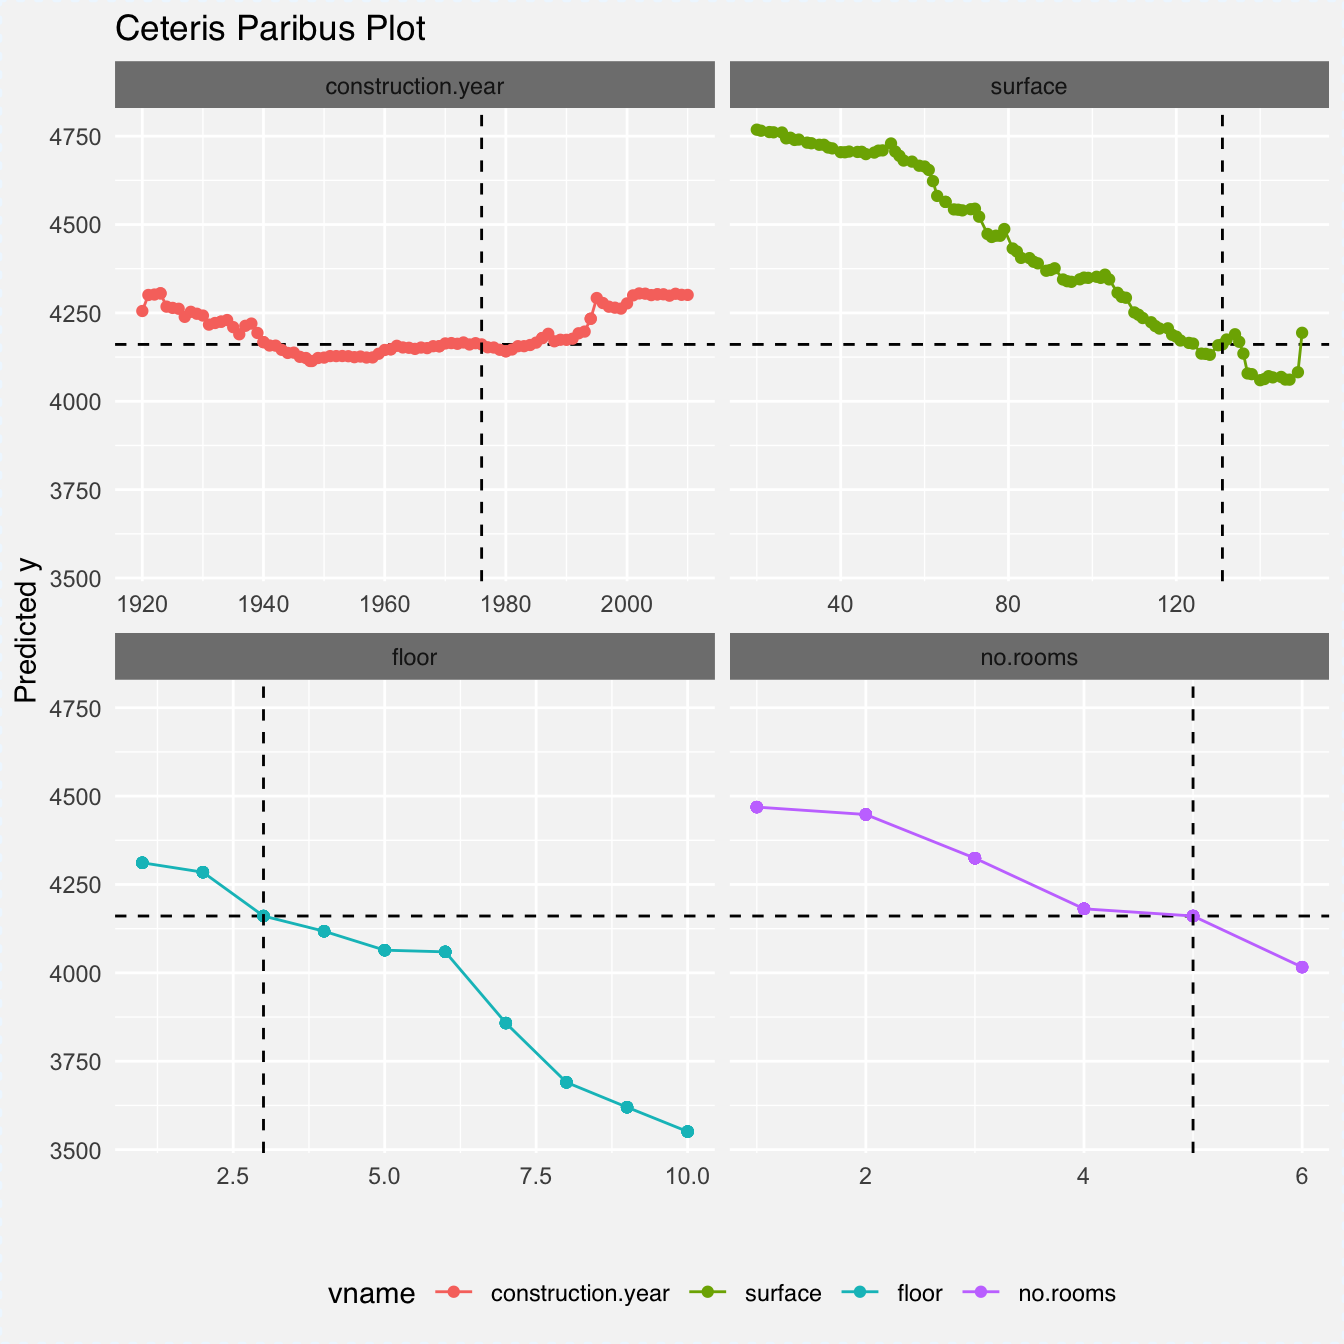
##           y_hat new_x             vname   x_quant quant relative_quant
## 1001   4832.833  1920 construction.year 0.6268889  0.00     -0.6268889
## 1001.1 4832.604  1921 construction.year 0.6268889  0.01     -0.6168889
## 1001.2 4832.375  1922 construction.year 0.6268889  0.02     -0.6068889
## 1001.3 4832.146  1923 construction.year 0.6268889  0.03     -0.5968889
## 1001.4 4832.146  1923 construction.year 0.6268889  0.04     -0.5868889
## 1001.5 4831.917  1924 construction.year 0.6268889  0.05     -0.5768889
##        label
## 1001      lm
## 1001.1    lm
## 1001.2    lm
## 1001.3    lm
## 1001.4    lm
## 1001.5    lm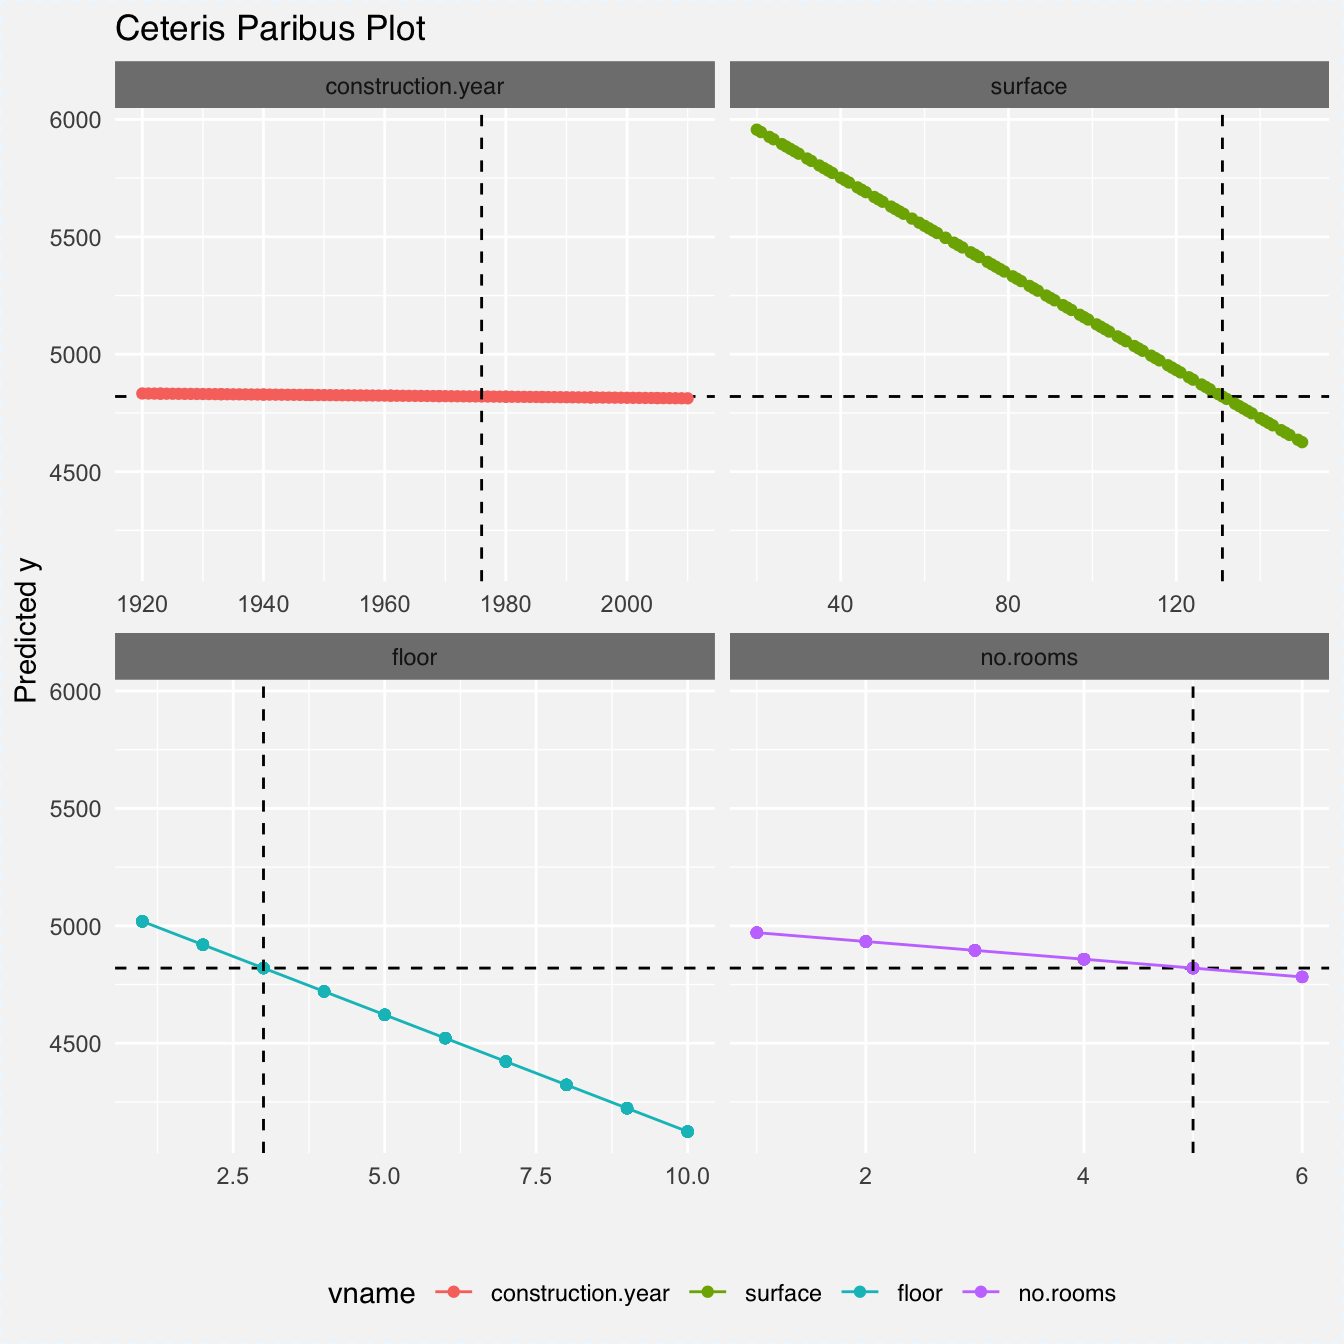
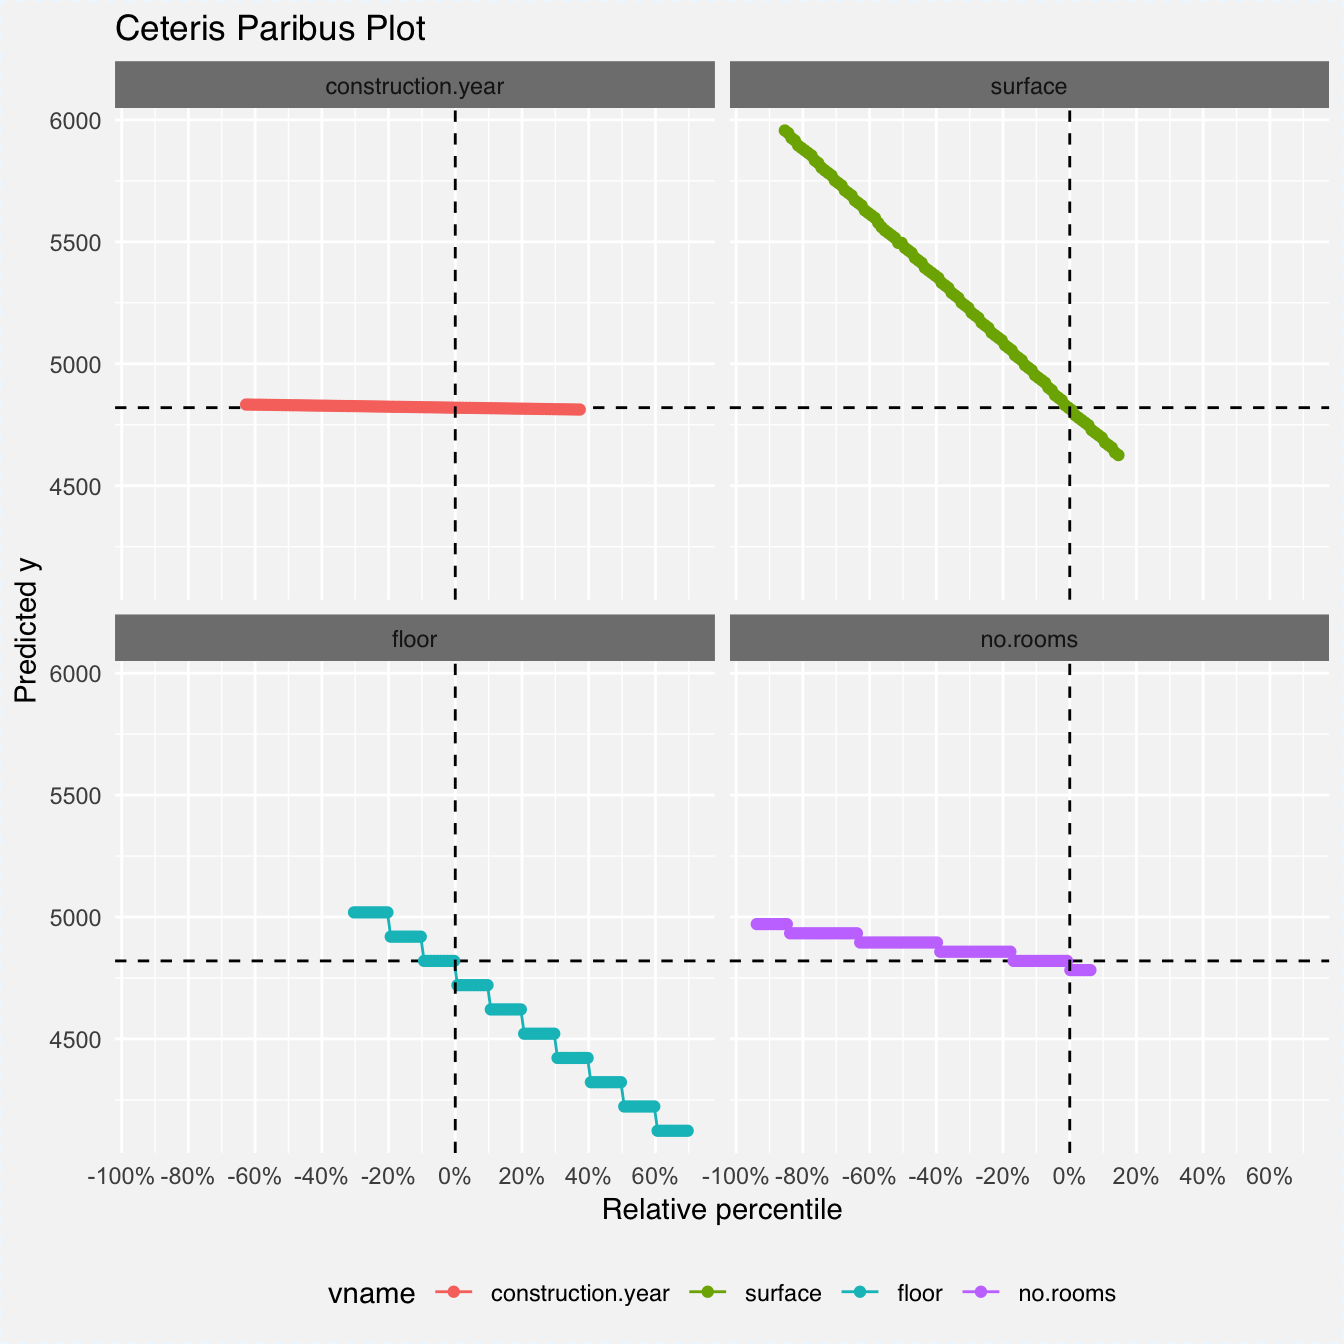
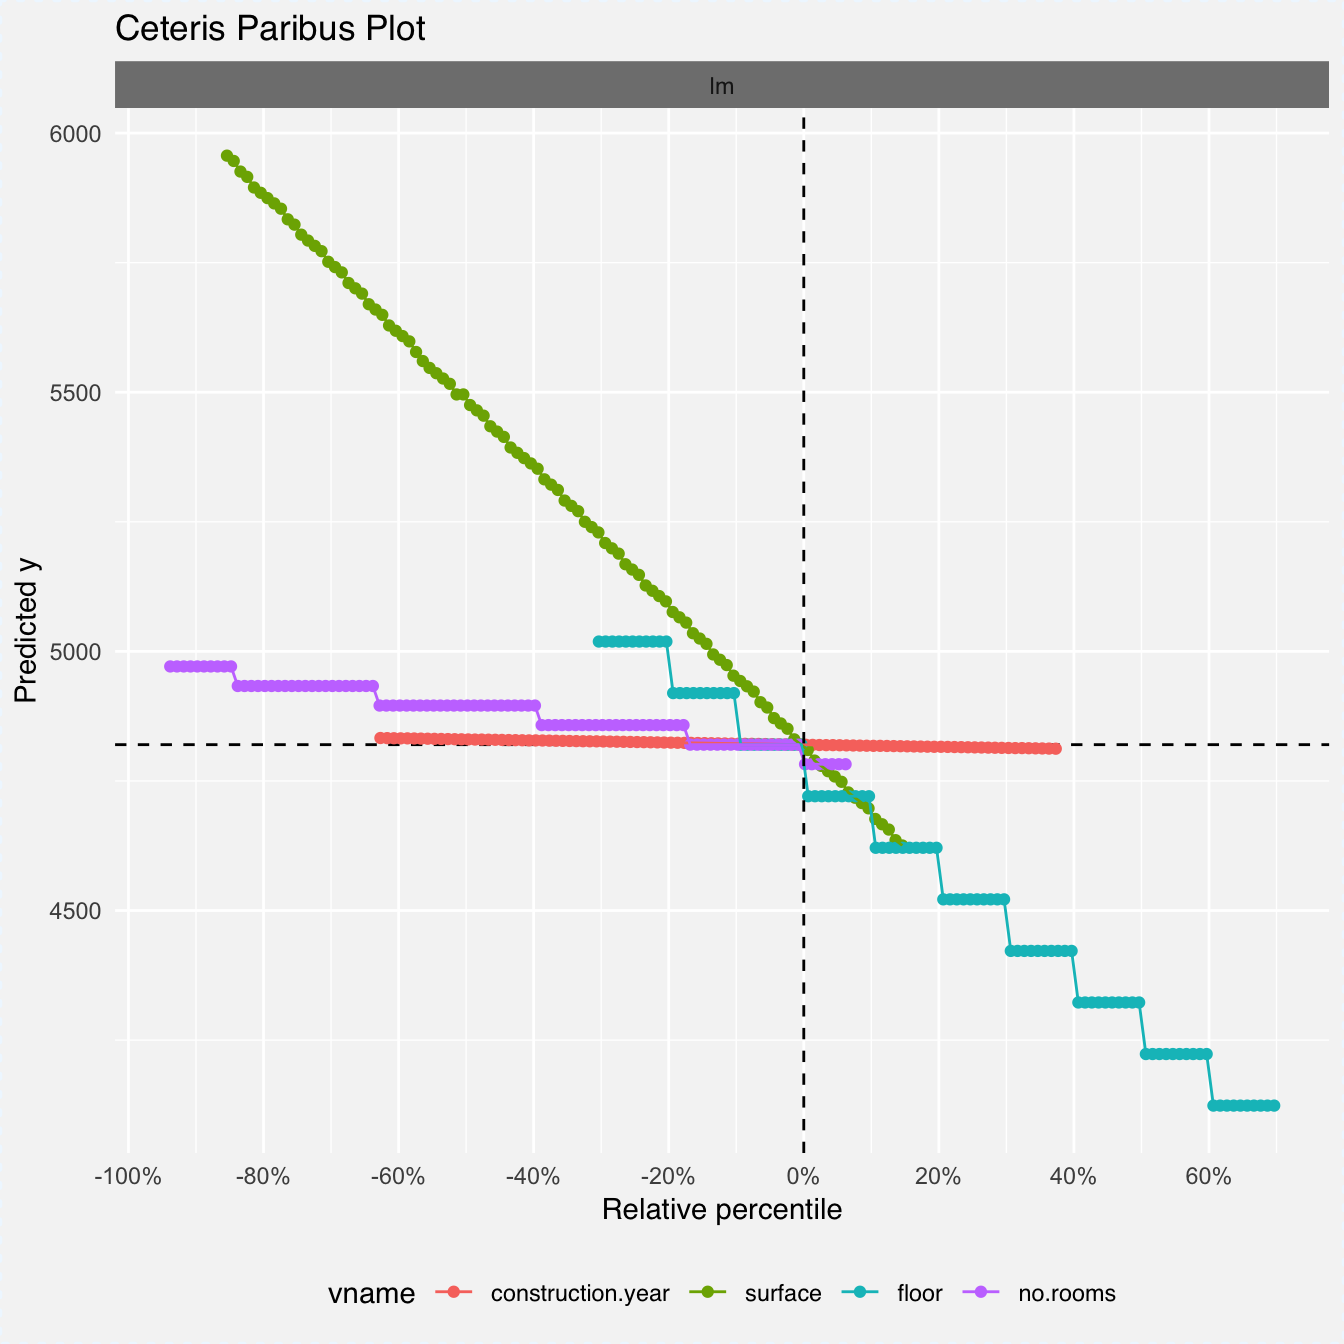
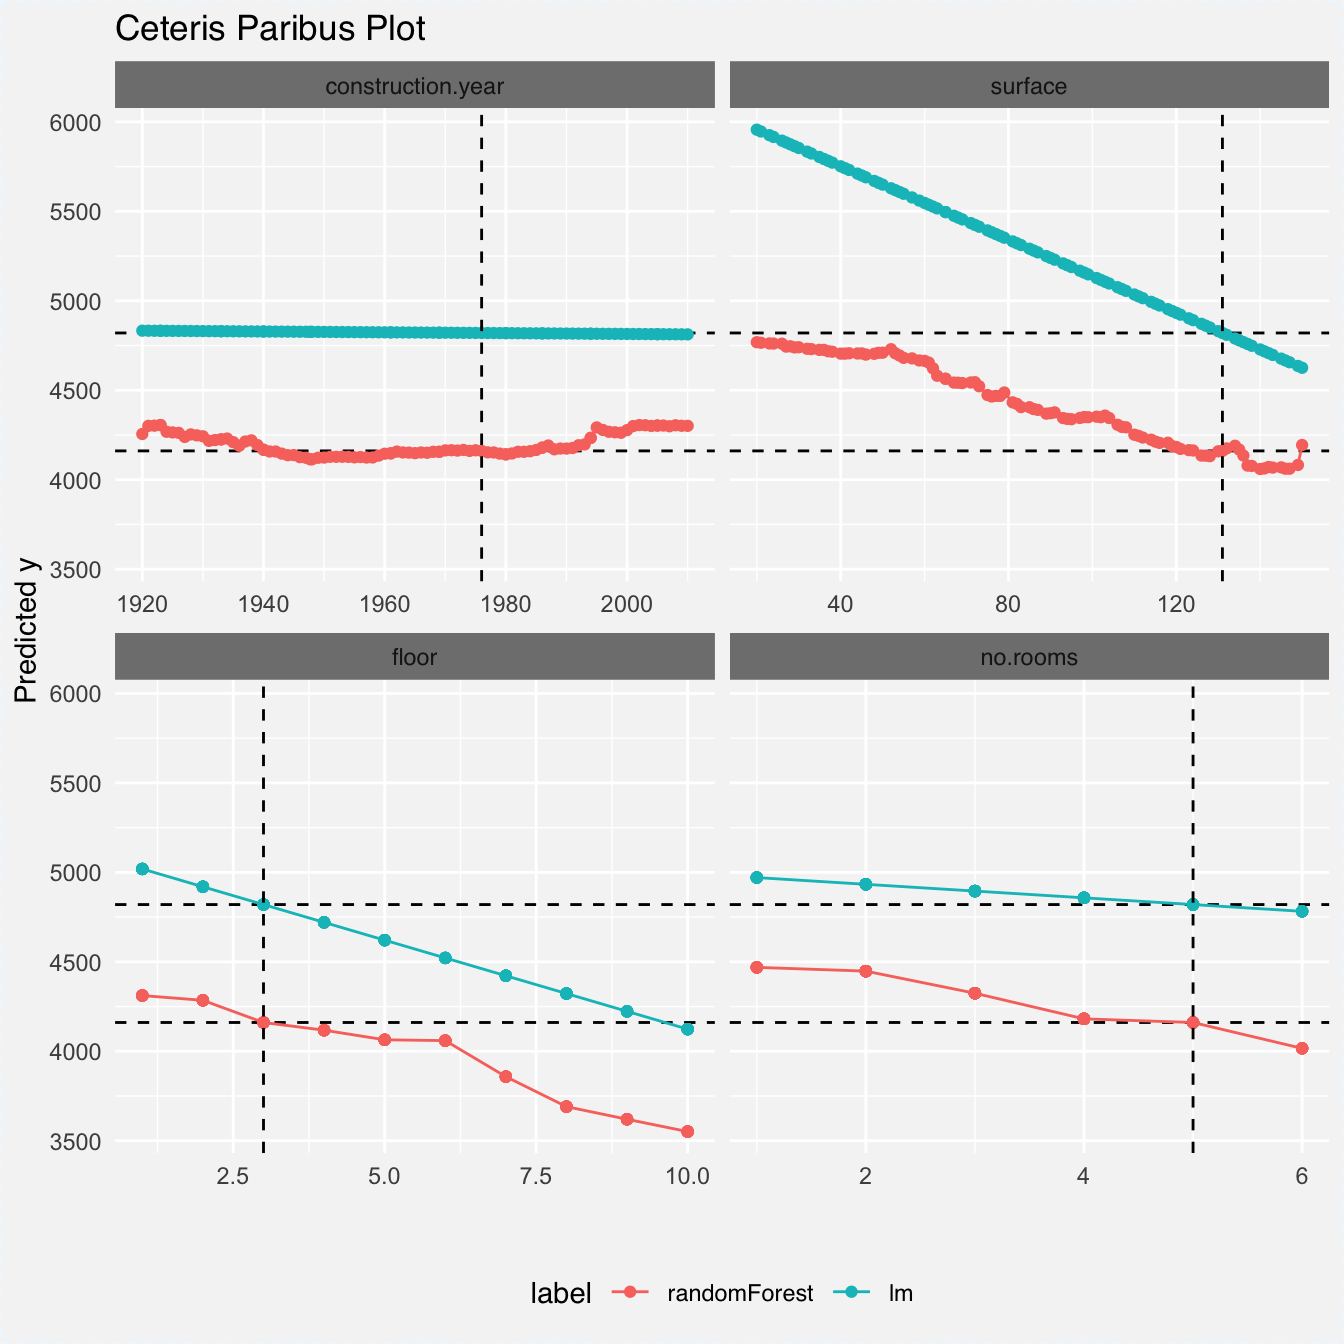
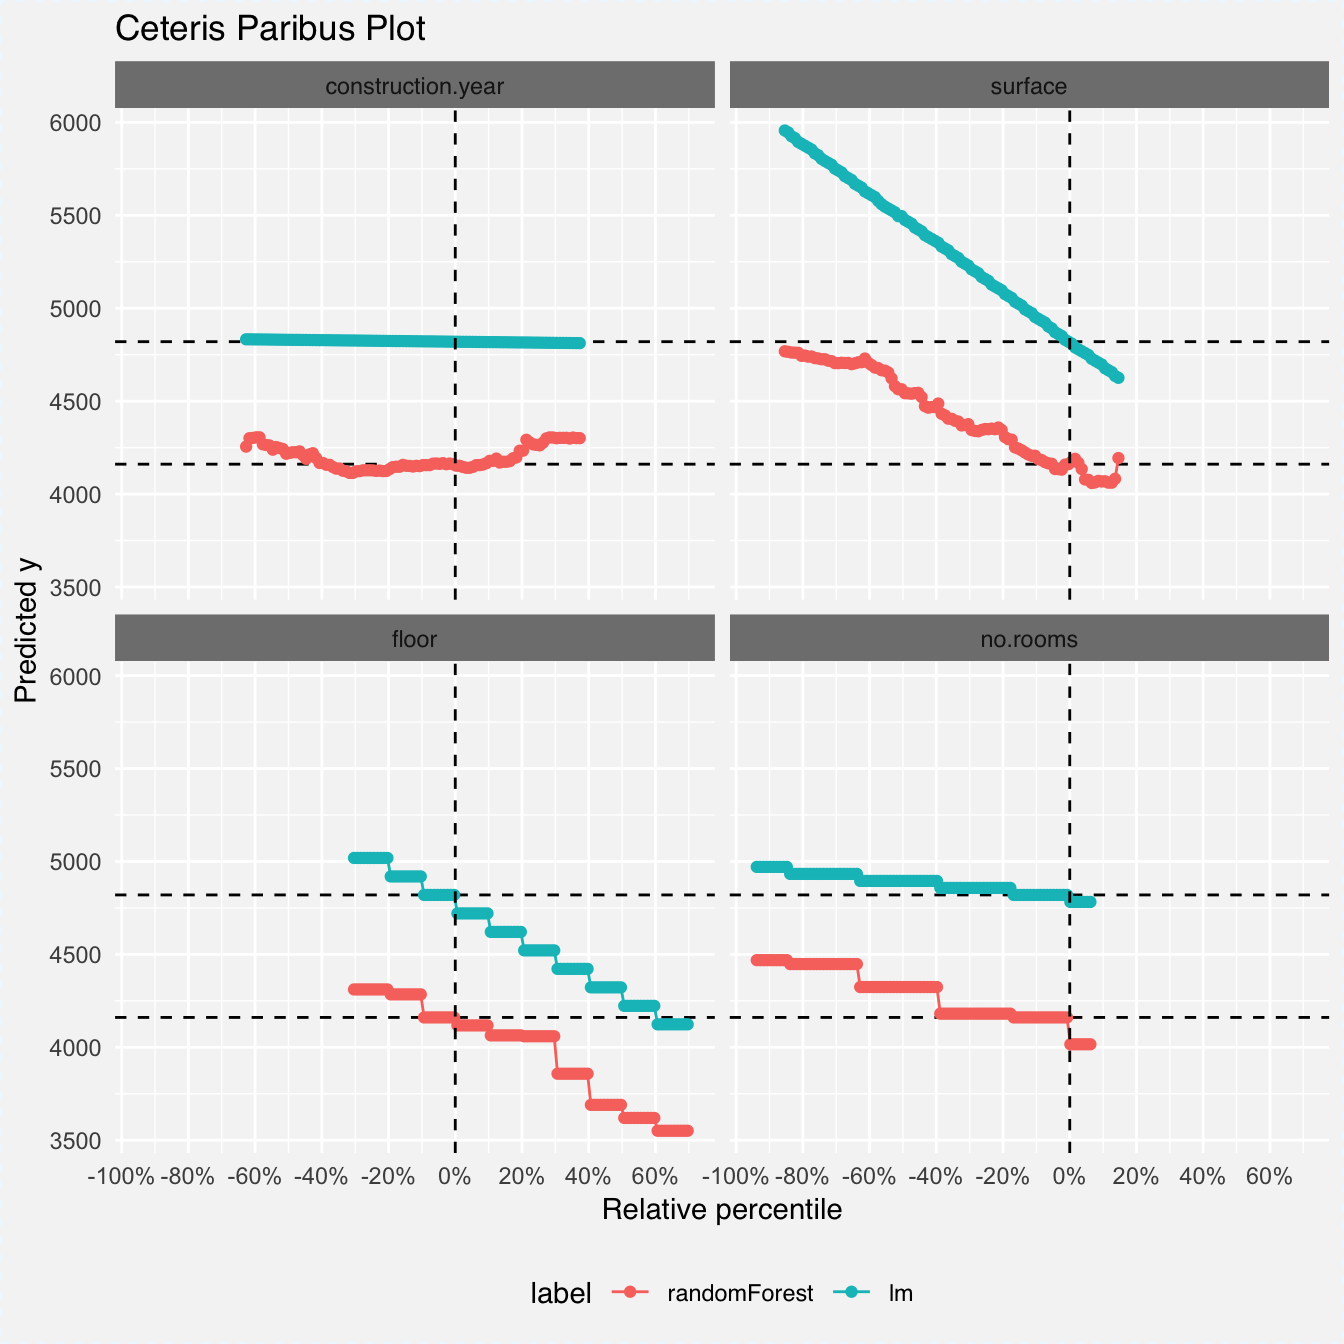
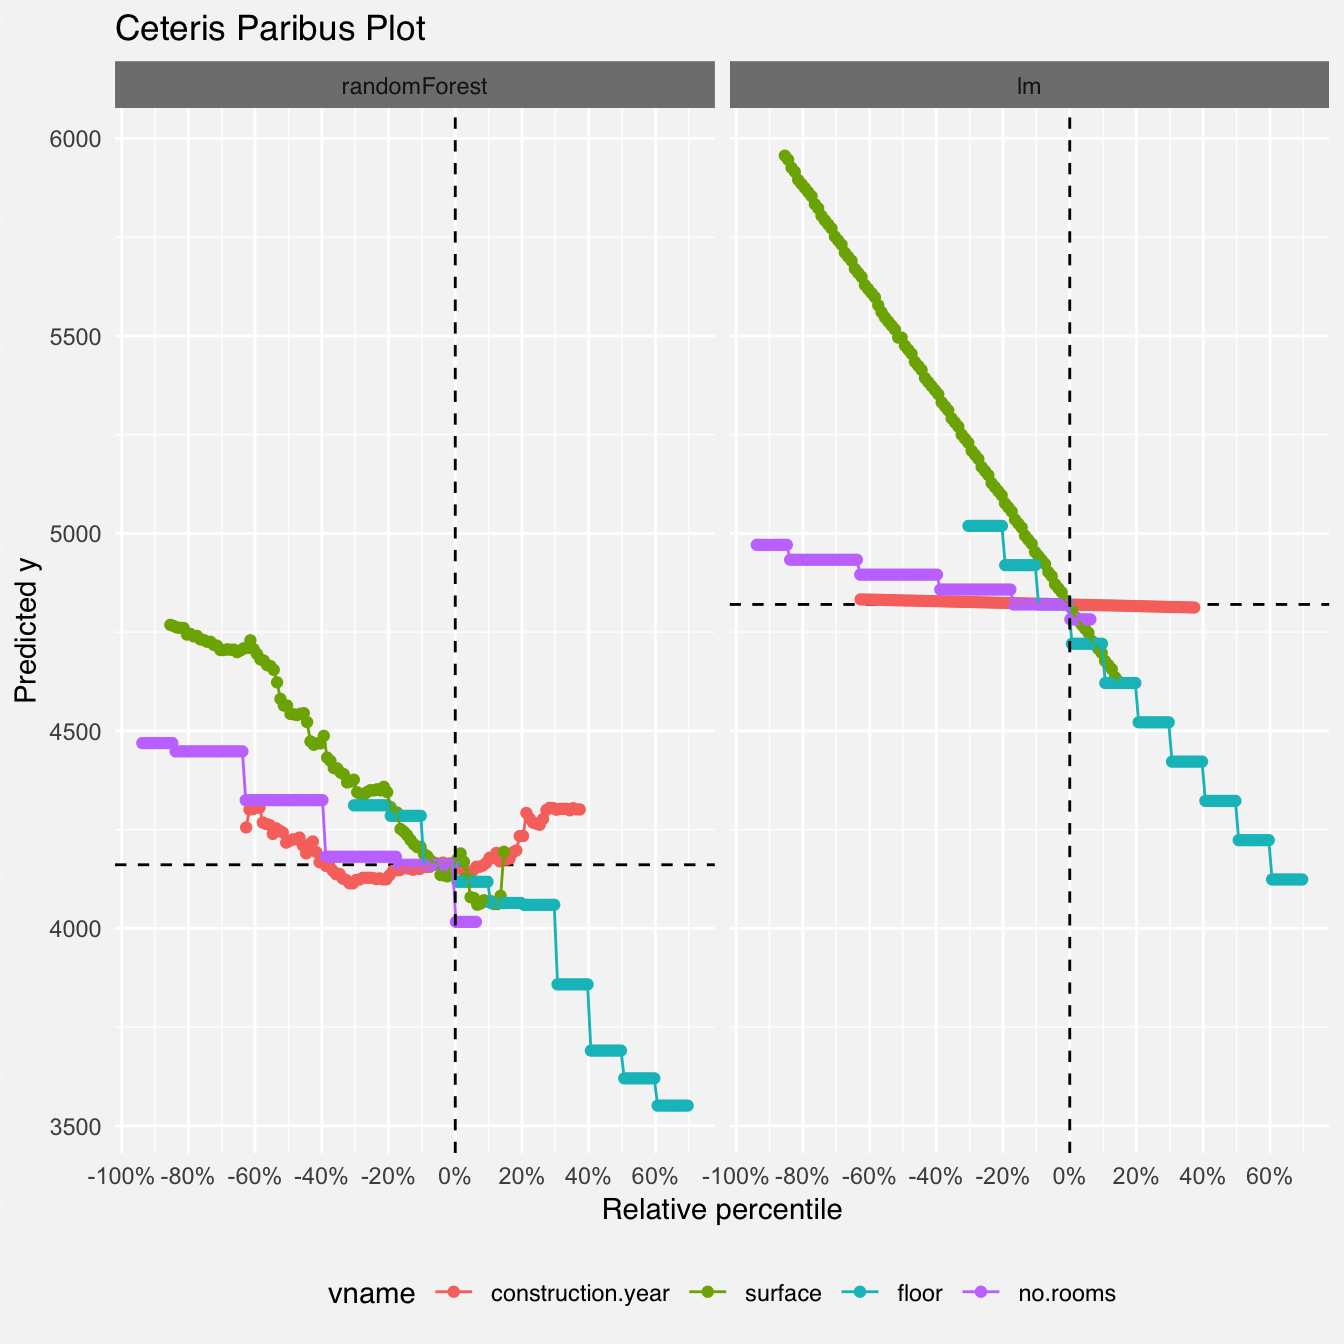
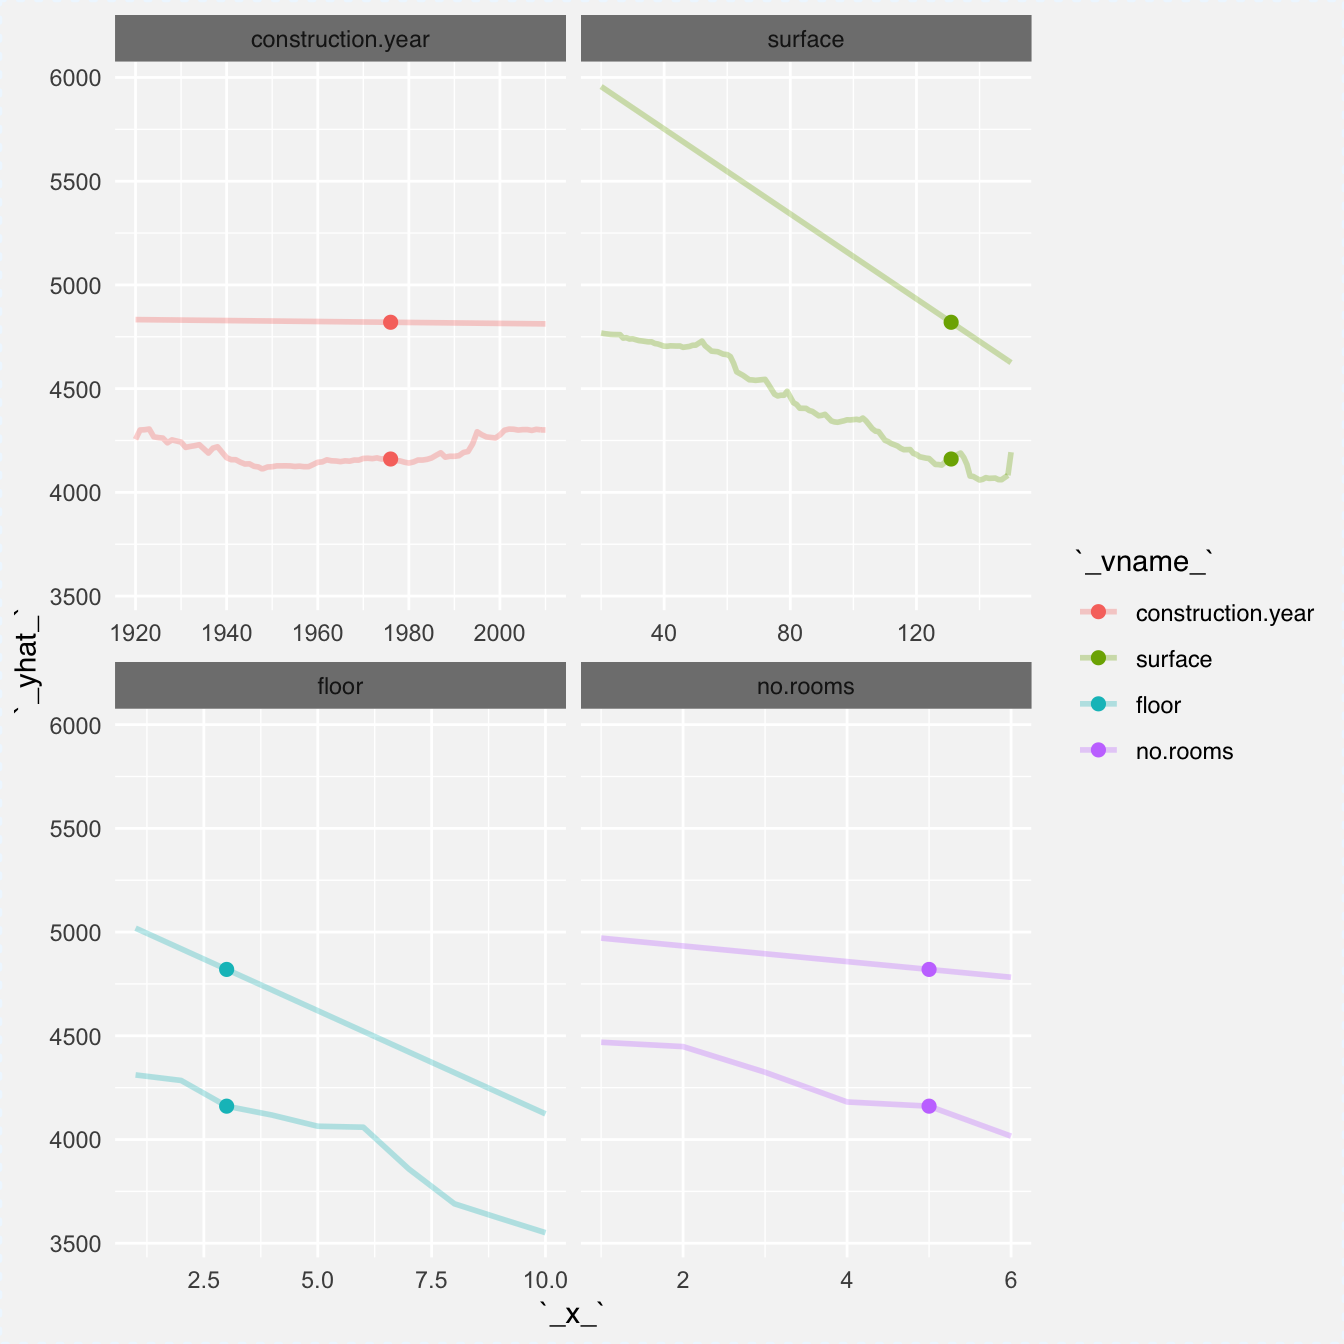
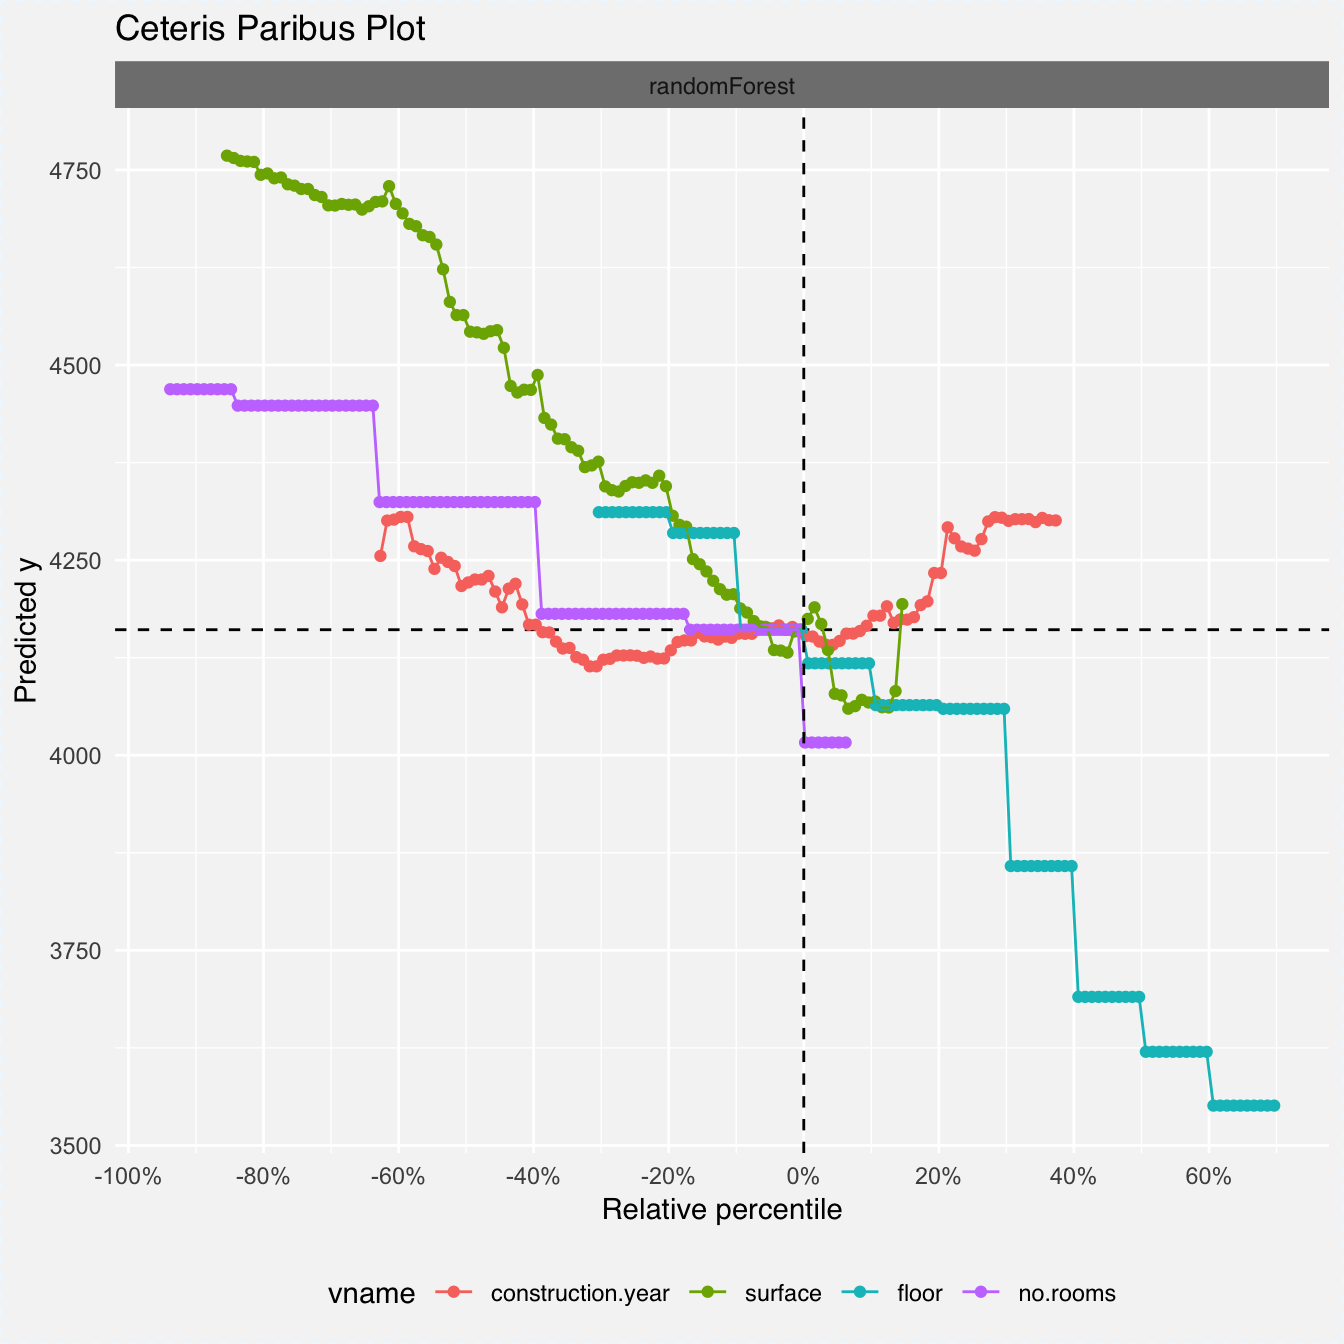
The new interface (ceteris_paribus)
Here is the one with ceteris_paribus().
## Top profiles    :
##        m2.price construction.year surface floor no.rooms    district
## 1001       4644              1920     131     3        5 Srodmiescie
## 1001.1     4644              1921     131     3        5 Srodmiescie
## 1001.2     4644              1922     131     3        5 Srodmiescie
## 1001.3     4644              1923     131     3        5 Srodmiescie
## 1001.4     4644              1923     131     3        5 Srodmiescie
## 1001.5     4644              1924     131     3        5 Srodmiescie
##          _yhat_           _vname_ _ids_      _label_
## 1001   4255.354 construction.year  1001 randomForest
## 1001.1 4300.702 construction.year  1001 randomForest
## 1001.2 4301.926 construction.year  1001 randomForest
## 1001.3 4305.352 construction.year  1001 randomForest
## 1001.4 4305.352 construction.year  1001 randomForest
## 1001.5 4267.723 construction.year  1001 randomForest
##
##
## Top observations:
##      m2.price construction.year surface floor no.rooms    district  _yhat_
## 1001     4644              1976     131     3        5 Srodmiescie 4160.84
##           _label_
## 1001 randomForest
## Top profiles    :
##        m2.price construction.year surface floor no.rooms    district
## 1001       4644              1920     131     3        5 Srodmiescie
## 1001.1     4644              1921     131     3        5 Srodmiescie
## 1001.2     4644              1922     131     3        5 Srodmiescie
## 1001.3     4644              1923     131     3        5 Srodmiescie
## 1001.4     4644              1923     131     3        5 Srodmiescie
## 1001.5     4644              1924     131     3        5 Srodmiescie
##          _yhat_           _vname_ _ids_ _label_
## 1001   4832.833 construction.year  1001      lm
## 1001.1 4832.604 construction.year  1001      lm
## 1001.2 4832.375 construction.year  1001      lm
## 1001.3 4832.146 construction.year  1001      lm
## 1001.4 4832.146 construction.year  1001      lm
## 1001.5 4831.917 construction.year  1001      lm
##
##
## Top observations:
##      m2.price construction.year surface floor no.rooms    district
## 1001     4644              1976     131     3        5 Srodmiescie
##        _yhat_ _label_
## 1001 4820.009      lm