Plot Ceteris Paribus Oscillations
Function 'plot.ceteris_paribus_oscillations' plots variable importance plots.
# S3 method for ceteris_paribus_oscillations
plot(x, ...)
Arguments
| x | a ceteris paribus oscillation explainer produced with function `calculate_oscillations()` |
|---|---|
| ... | other explainers that shall be plotted together |
Value
a ggplot2 object
Examples
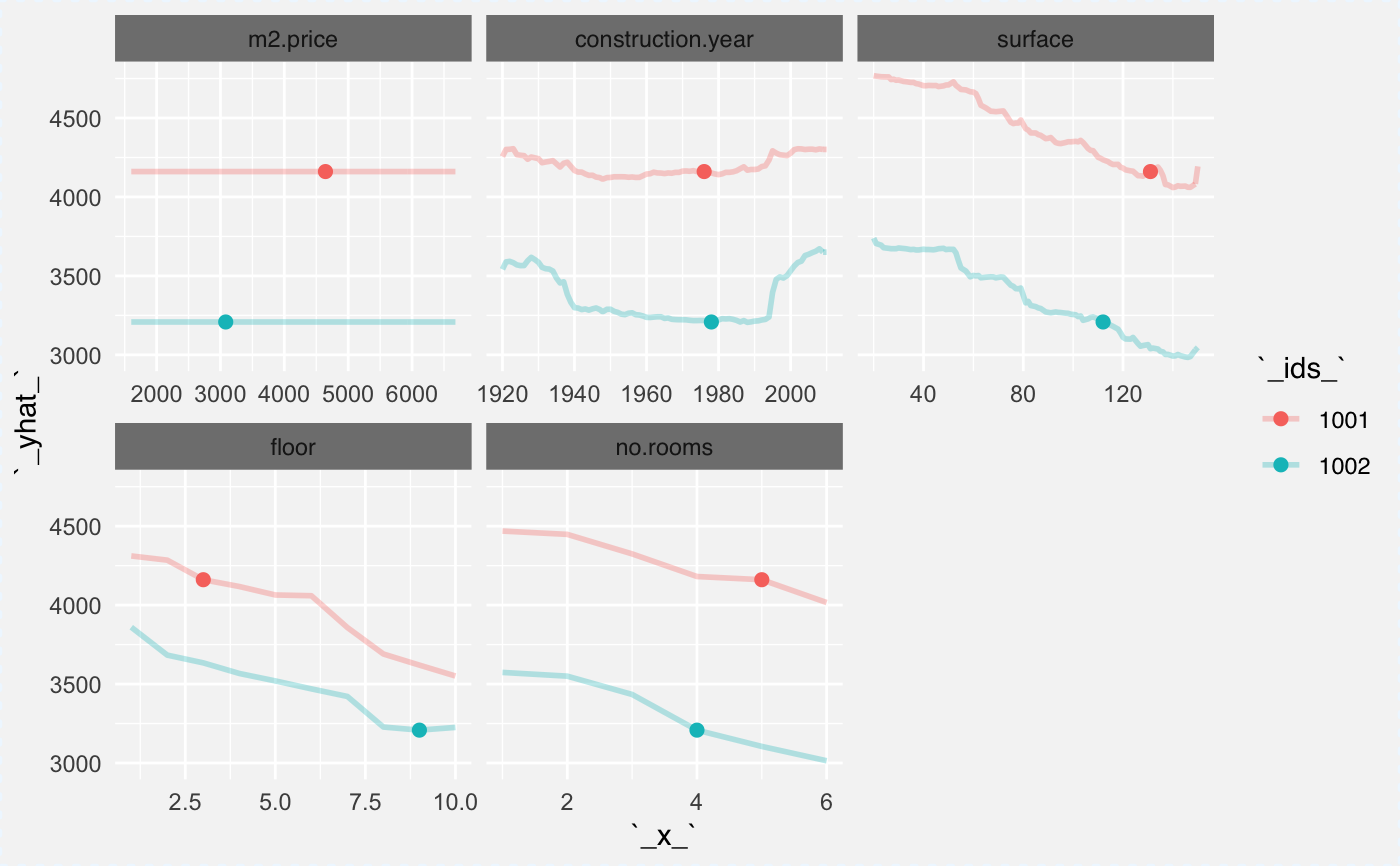
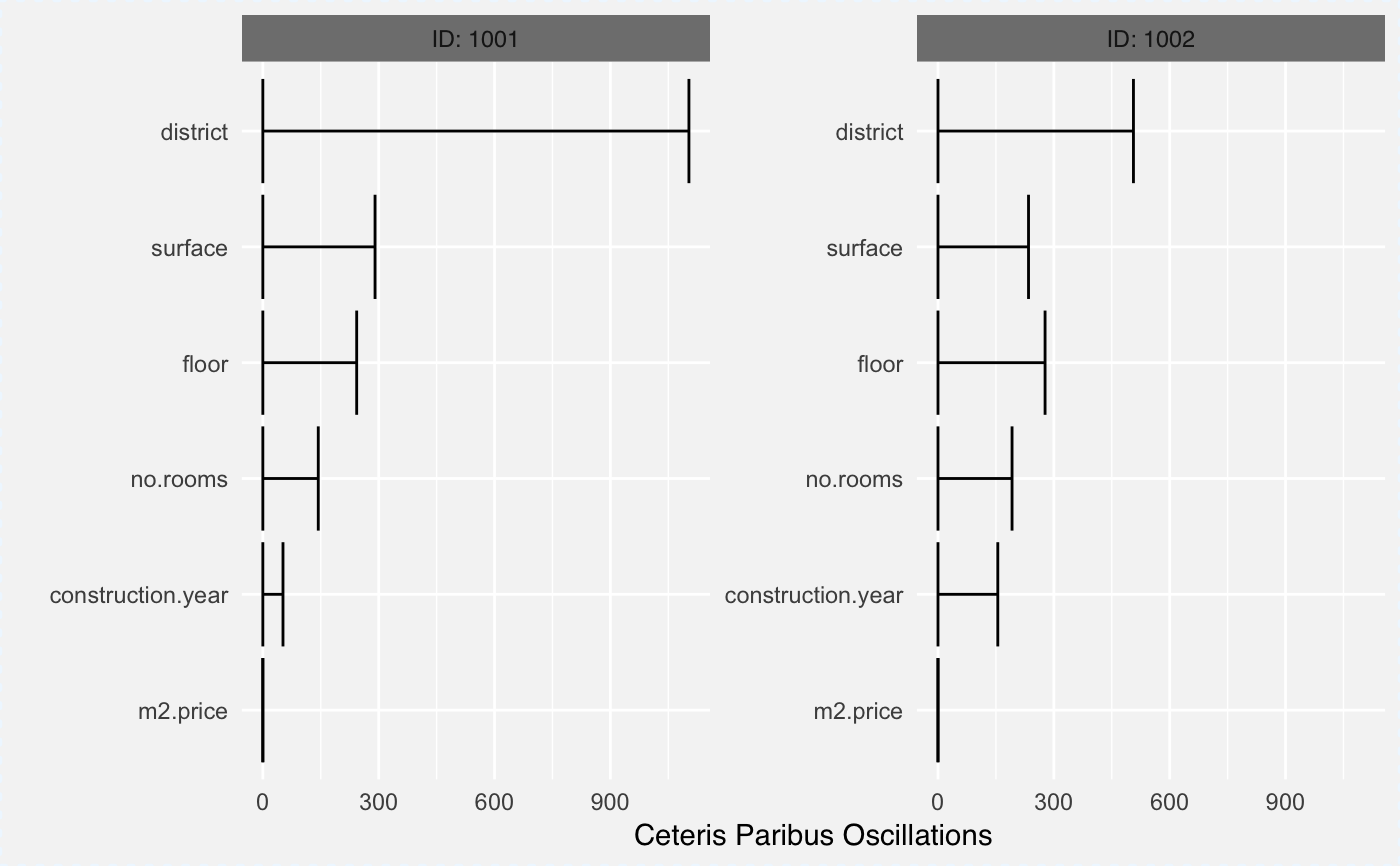
library("DALEX")library("randomForest") set.seed(59) apartments_rf_model <- randomForest(m2.price ~ construction.year + surface + floor + no.rooms + district, data = apartments) explainer_rf <- explain(apartments_rf_model, data = apartmentsTest, y = apartmentsTest$m2.price) apartment <- apartmentsTest[1:2,] cp_rf <- ceteris_paribus(explainer_rf, apartment) plot(cp_rf, color = "_ids_")#> _vname_ _ids_ oscillations #> 11 district 1001 1103.42482 #> 12 district 1002 506.15312 #> 5 surface 1001 290.57755 #> 8 floor 1002 277.28811 #> 7 floor 1001 243.03520 #> 6 surface 1002 234.44640 #> 10 no.rooms 1002 191.77770 #> 4 construction.year 1002 154.86742 #> 9 no.rooms 1001 143.53000 #> 3 construction.year 1001 52.17142 #> 1 m2.price 1001 0.00000 #> 2 m2.price 1002 0.00000plot(vips)