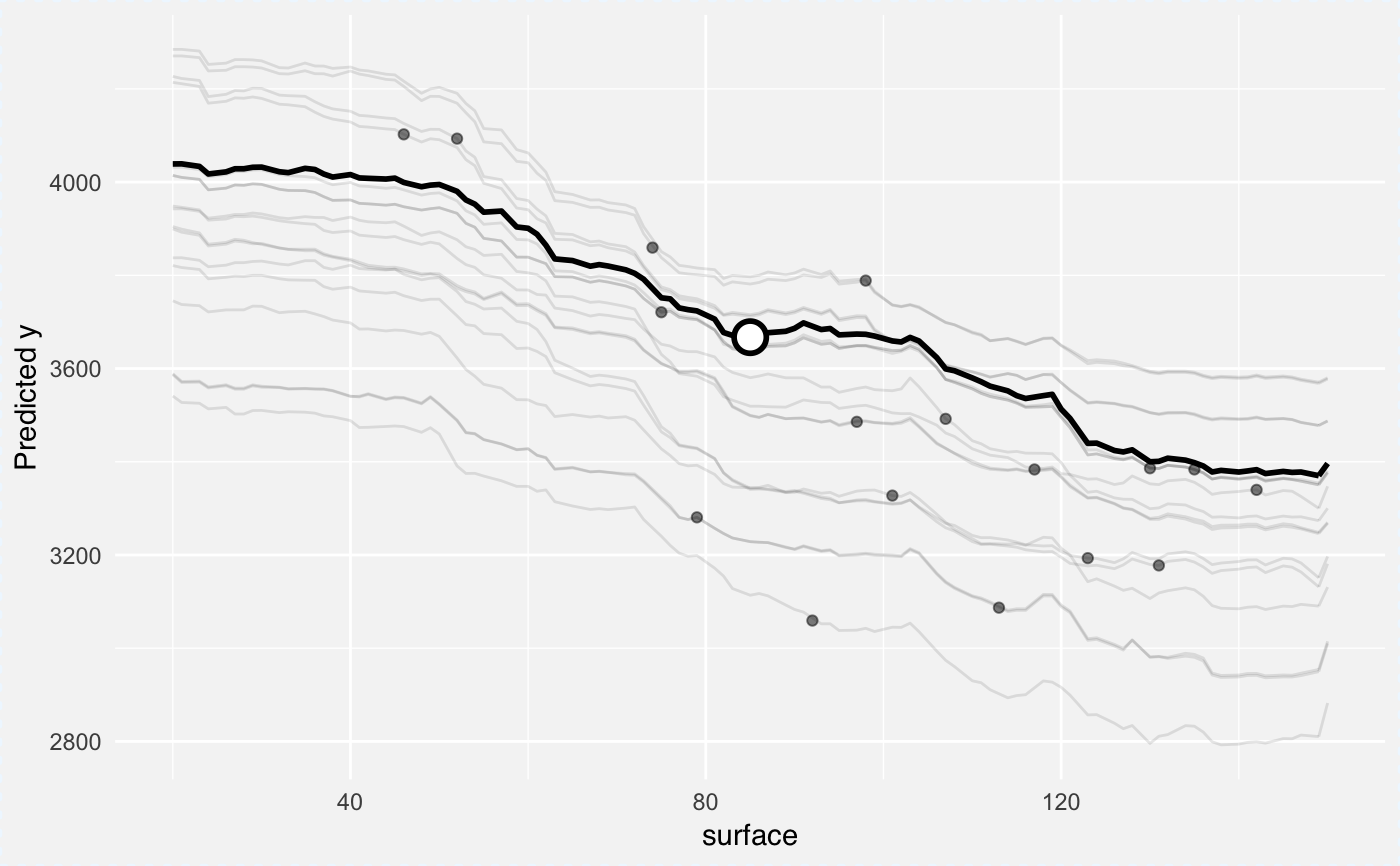
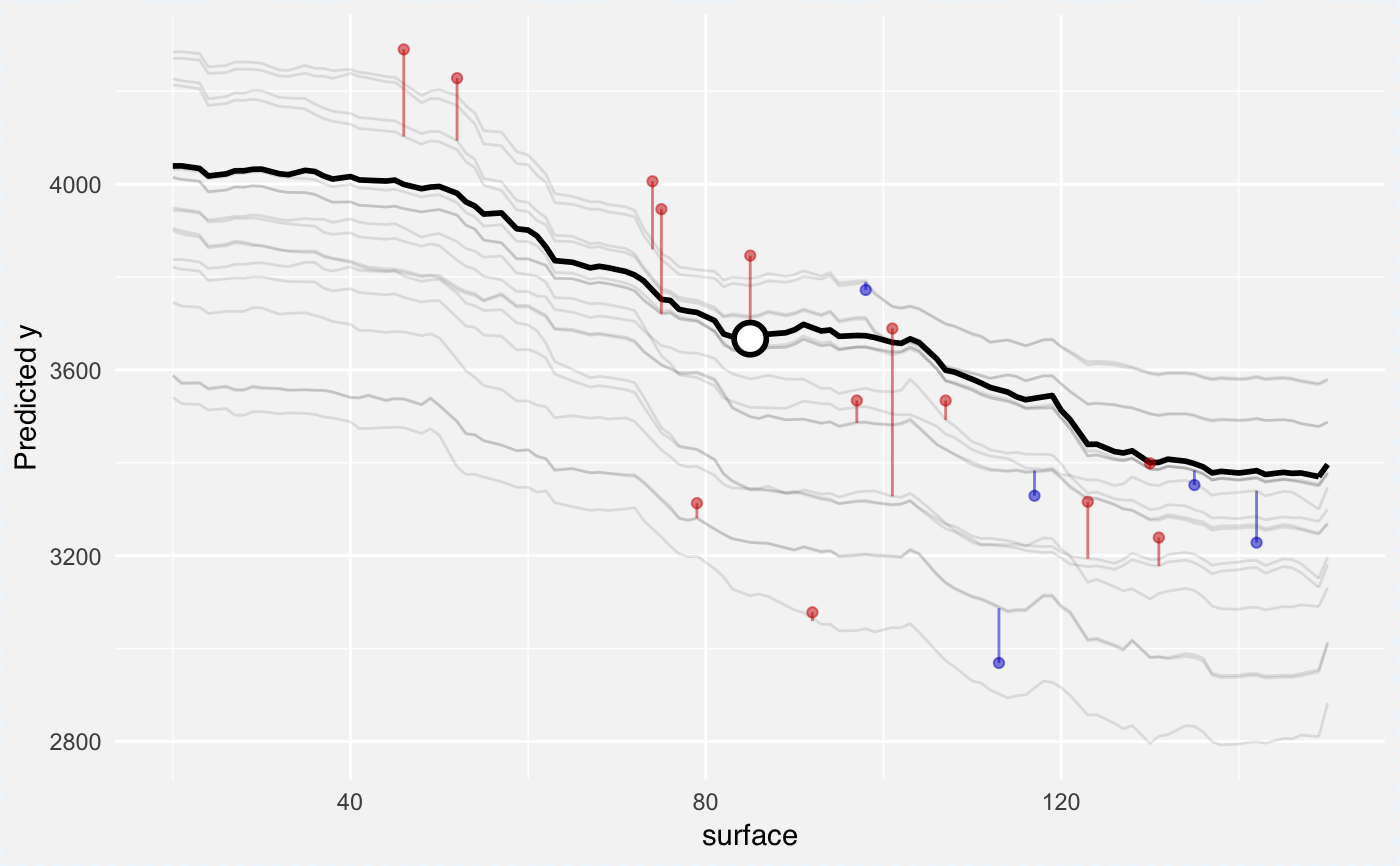
Local Fit Plots / Wangkardu Explanations
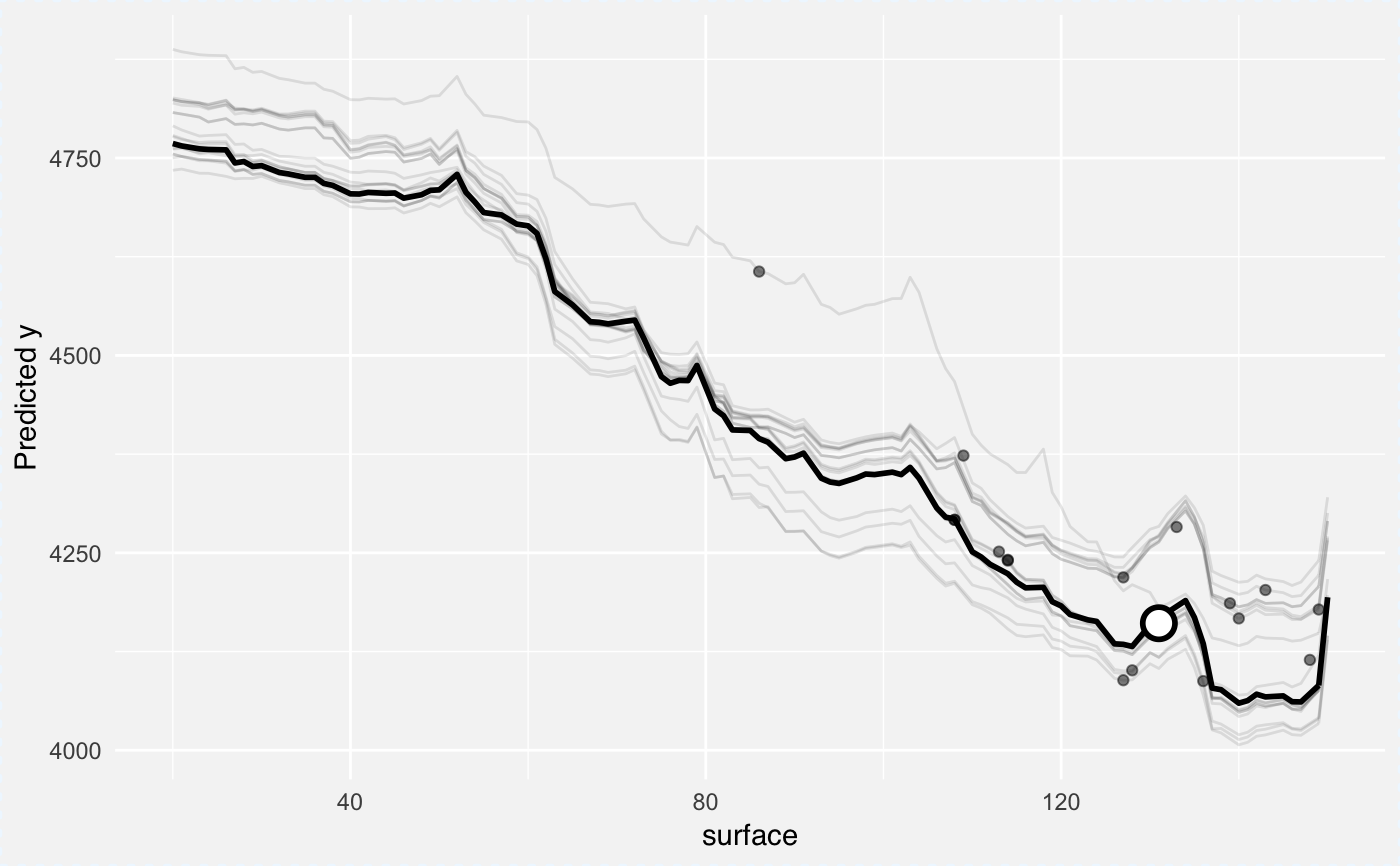
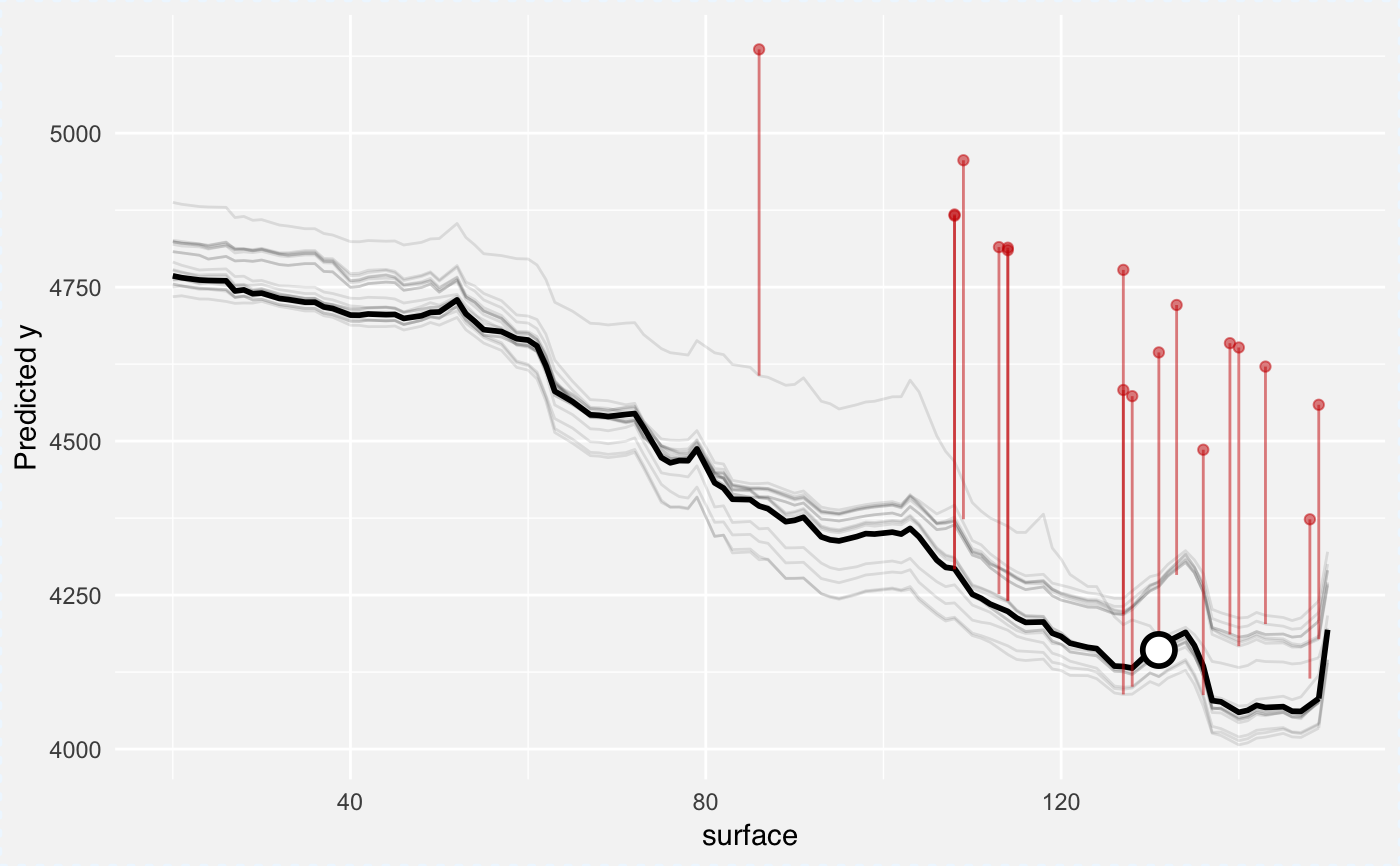
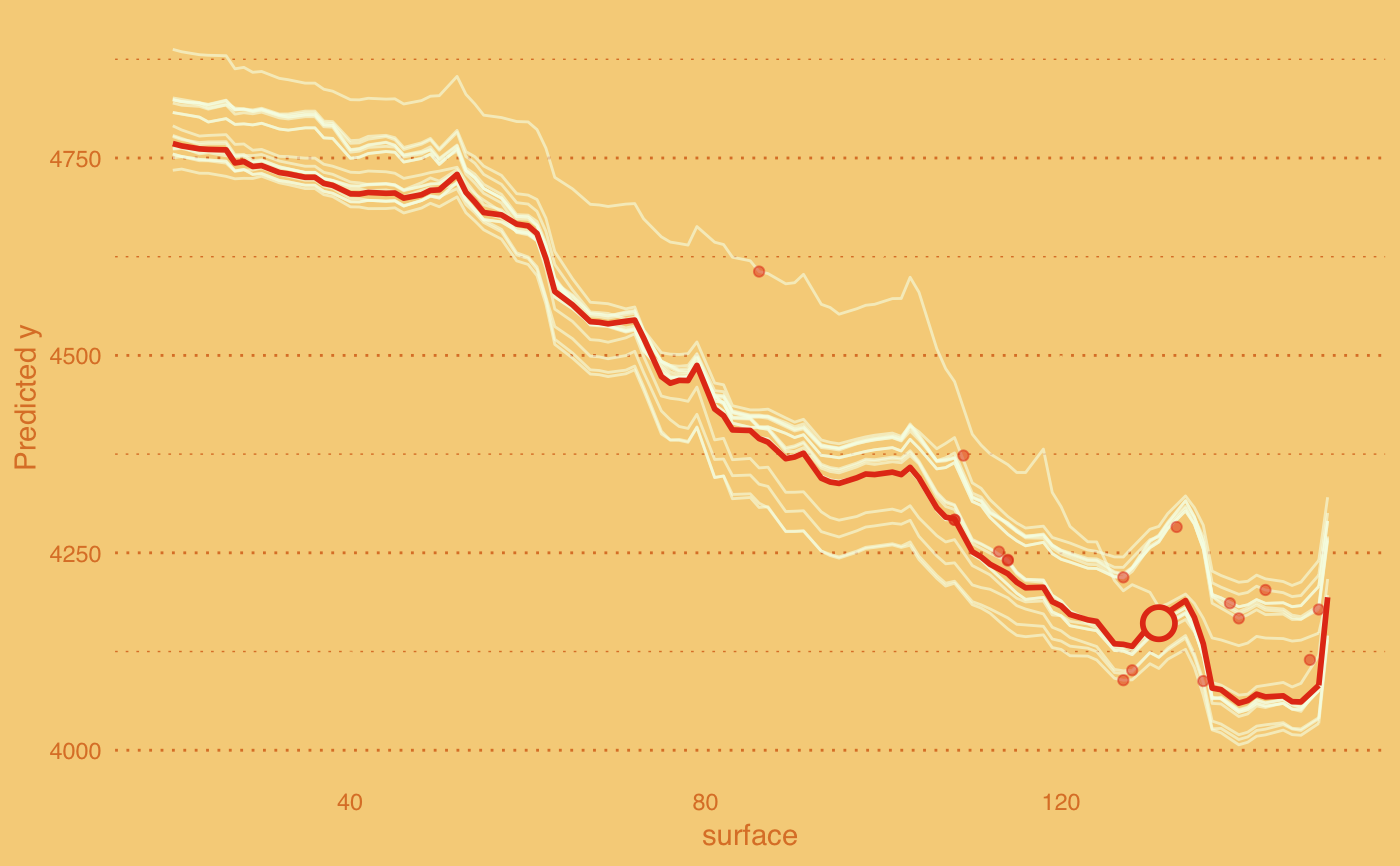
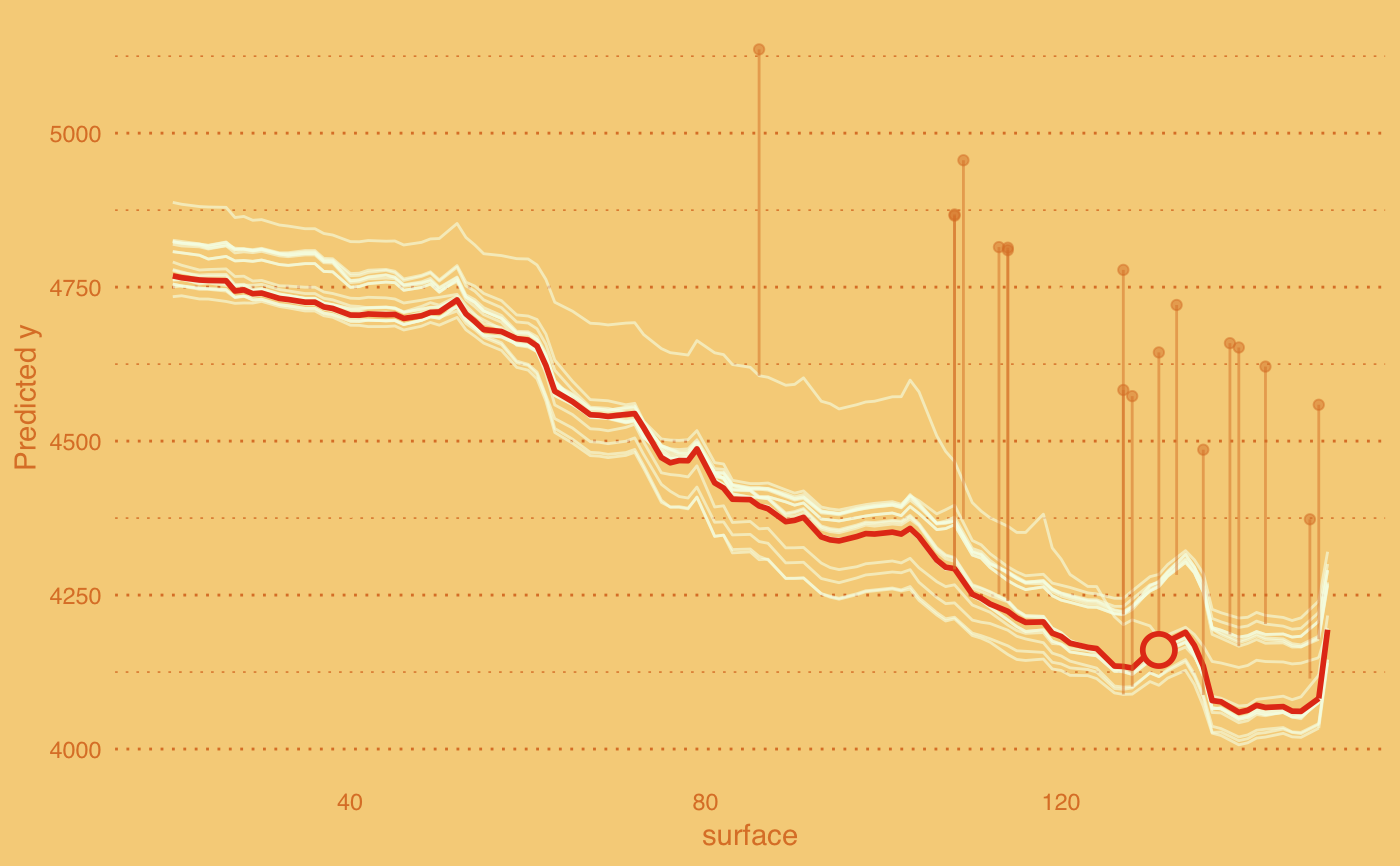
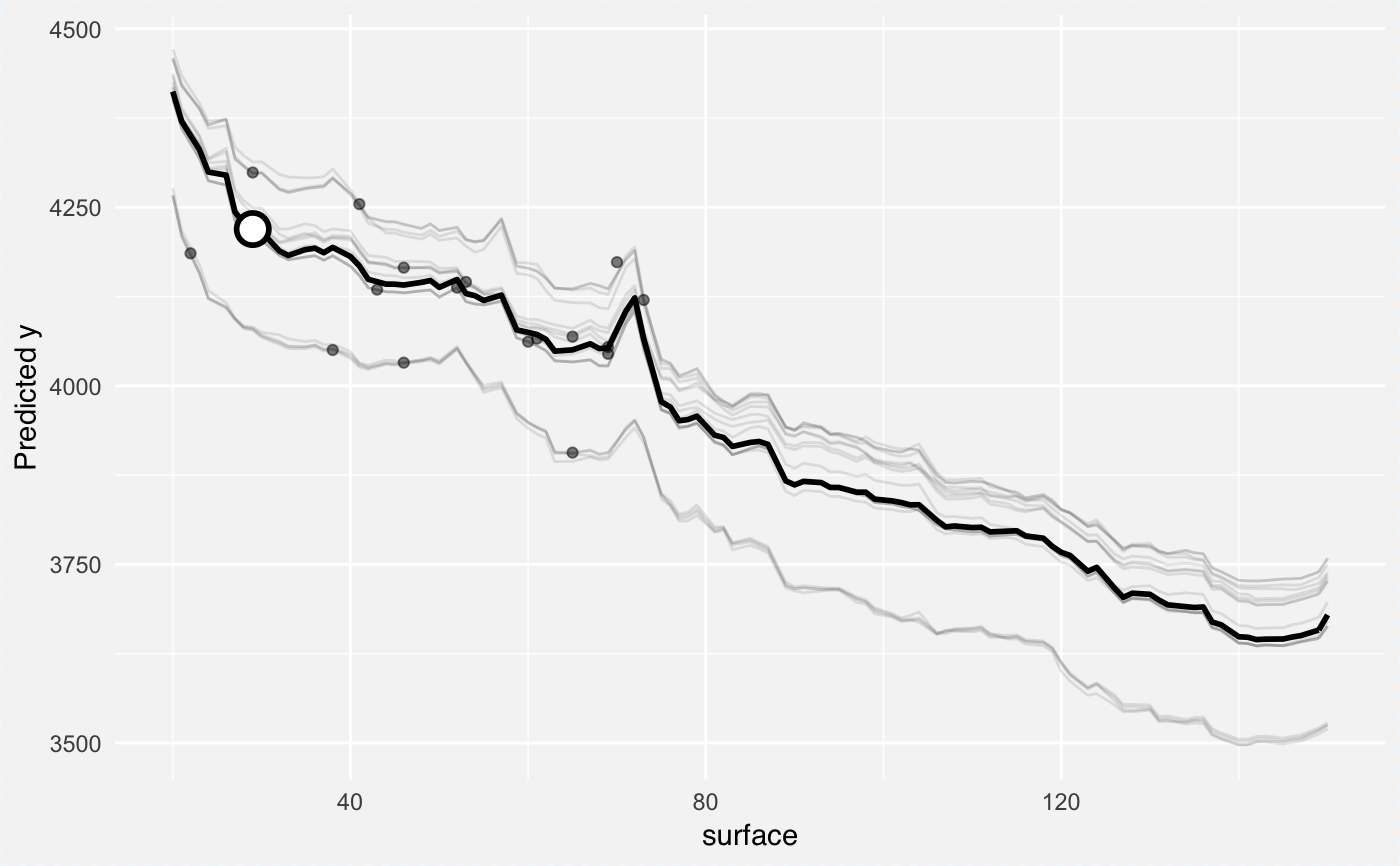
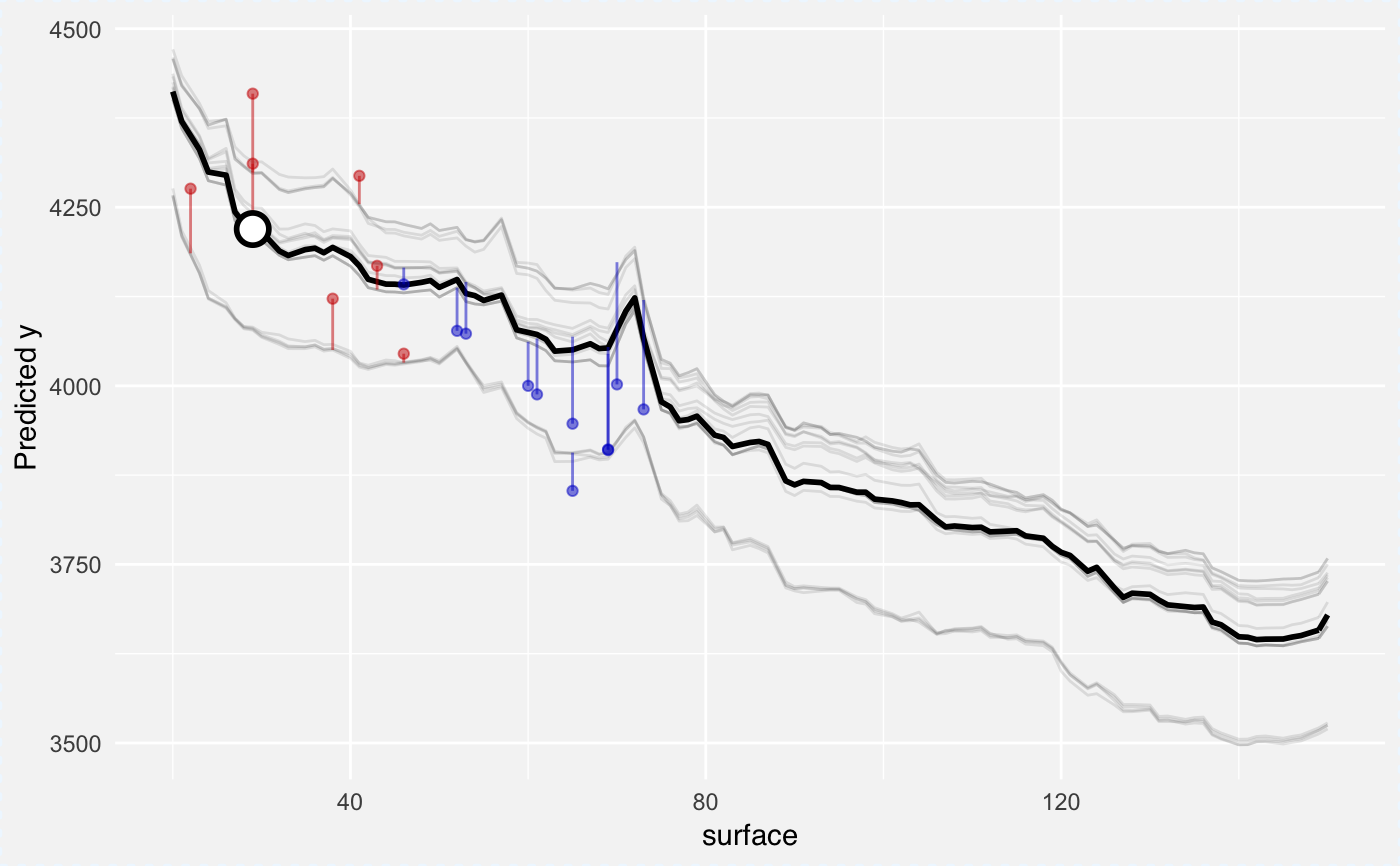
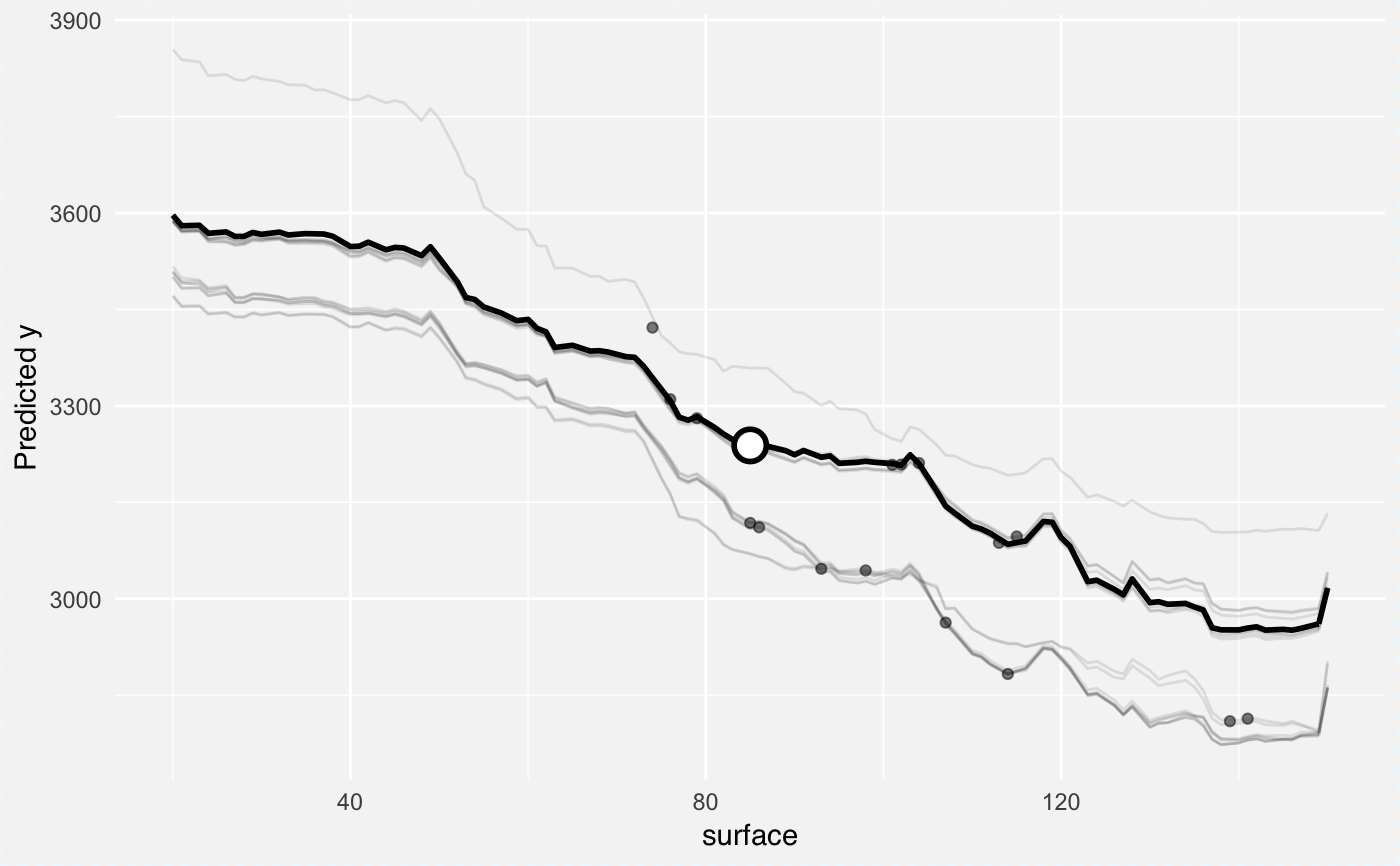
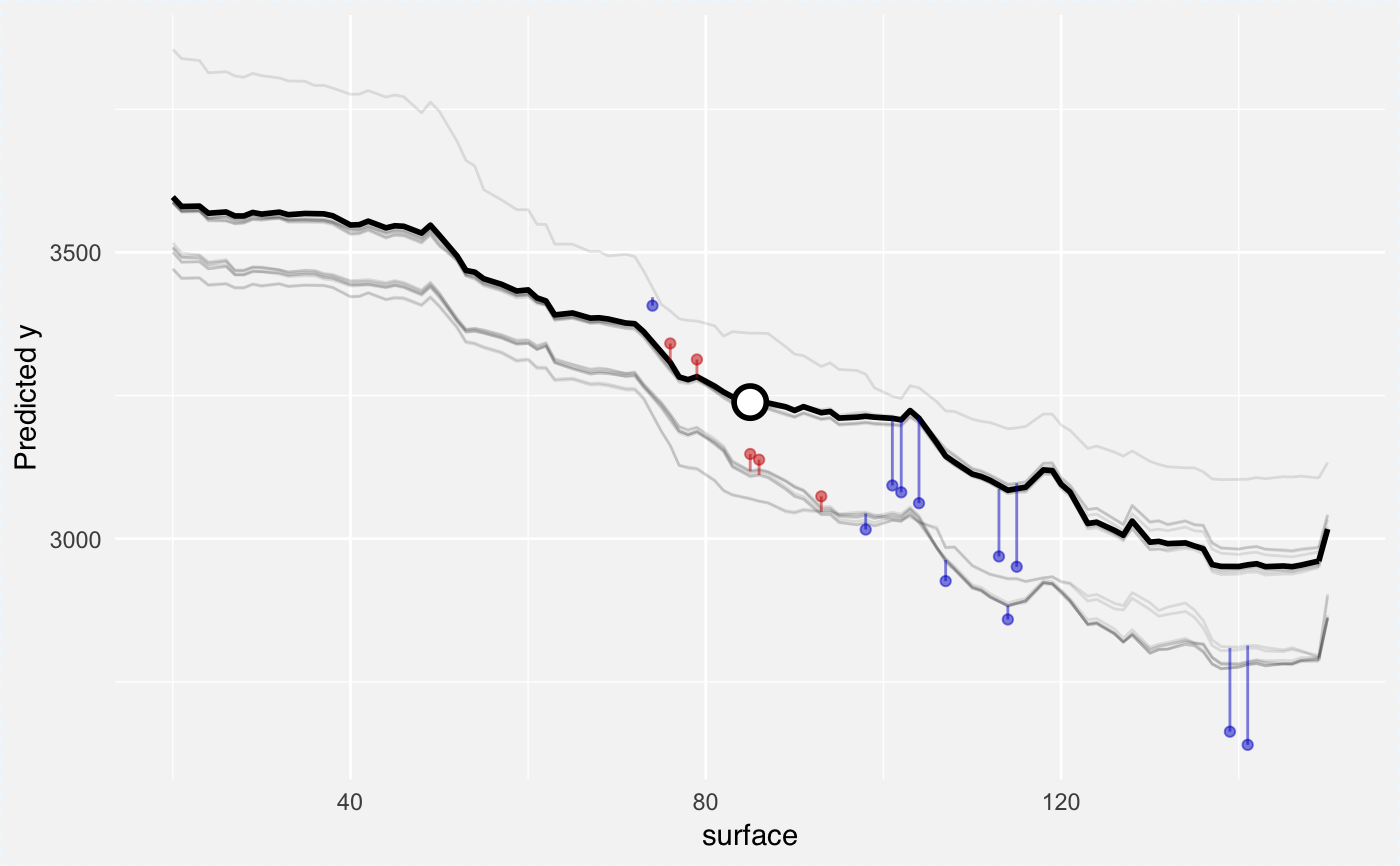
Function 'plot.local_fit_explainer' plots Local Fit Plots for a single prediction / observation.
# S3 method for local_fit_explainer
plot(x, ..., plot_residuals = TRUE,
  palette = "default")
Arguments
| x | a local fir explainer produced with the 'local_fit' function |
|---|---|
| ... | other explainers that shall be plotted together |
| plot_residuals | if TRUE (default) then residuals are plotted as red/blue bars |
| palette | color palette. Currently the choice is limited to 'wangkardu' and 'default' |
Value
a ggplot2 object
Examples
library("DALEX")library("randomForest") set.seed(59) apartments_rf_model <- randomForest(m2.price ~ construction.year + surface + floor + no.rooms + district, data = apartments) explainer_rf <- explain(apartments_rf_model, data = apartmentsTest[,2:6], y = apartmentsTest$m2.price) new_apartment <- apartmentsTest[1, ] new_apartment#> m2.price construction.year surface floor no.rooms district #> 1001 4644 1976 131 3 5 Srodmiesciecr_rf <- local_fit(explainer_rf, observation = new_apartment, select_points = 0.002, selected_variable = "surface") plot(cr_rf, plot_residuals = FALSE)plot(cr_rf)cr_rf <- local_fit(explainer_rf, observation = new_apartment, select_points = 0.002, selected_variable = "surface") plot(cr_rf, plot_residuals = FALSE, palette = "wangkardu")plot(cr_rf, palette = "wangkardu")new_apartment <- apartmentsTest[10, ] cr_rf <- local_fit(explainer_rf, observation = new_apartment, select_points = 0.002, selected_variable = "surface") plot(cr_rf, plot_residuals = FALSE)plot(cr_rf)new_apartment <- apartmentsTest[302, ] cr_rf <- local_fit(explainer_rf, observation = new_apartment, select_points = 0.002, selected_variable = "surface") plot(cr_rf, plot_residuals = FALSE)plot(cr_rf)new_apartment <- apartmentsTest[720, ] cr_rf <- local_fit(explainer_rf, observation = new_apartment, select_points = 0.002, selected_variable = "surface") plot(cr_rf, plot_residuals = FALSE)plot(cr_rf)