Plot What If 2D Explanations
Function 'plot.what_if_2d_explainer' plots What-If Plots for a single prediction / observation.
# S3 method for what_if_2d_explainer
plot(x, ..., split_ncol = NULL,
  add_raster = TRUE, add_contour = TRUE, add_observation = TRUE,
  bins = 3)
Arguments
| x | a ceteris paribus explainer produced with the 'what_if_2d' function |
|---|---|
| ... | currently will be ignored |
| split_ncol | number of columns for the 'facet_wrap' |
| add_raster | if TRUE then `geom_raster` will be added to present levels with diverging colors |
| add_contour | if TRUE then `geom_contour` will be added to present contours |
| add_observation | if TRUE then `geom_point` will be added to present observation that is explained |
| bins | number of contours to be added |
Value
a ggplot2 object
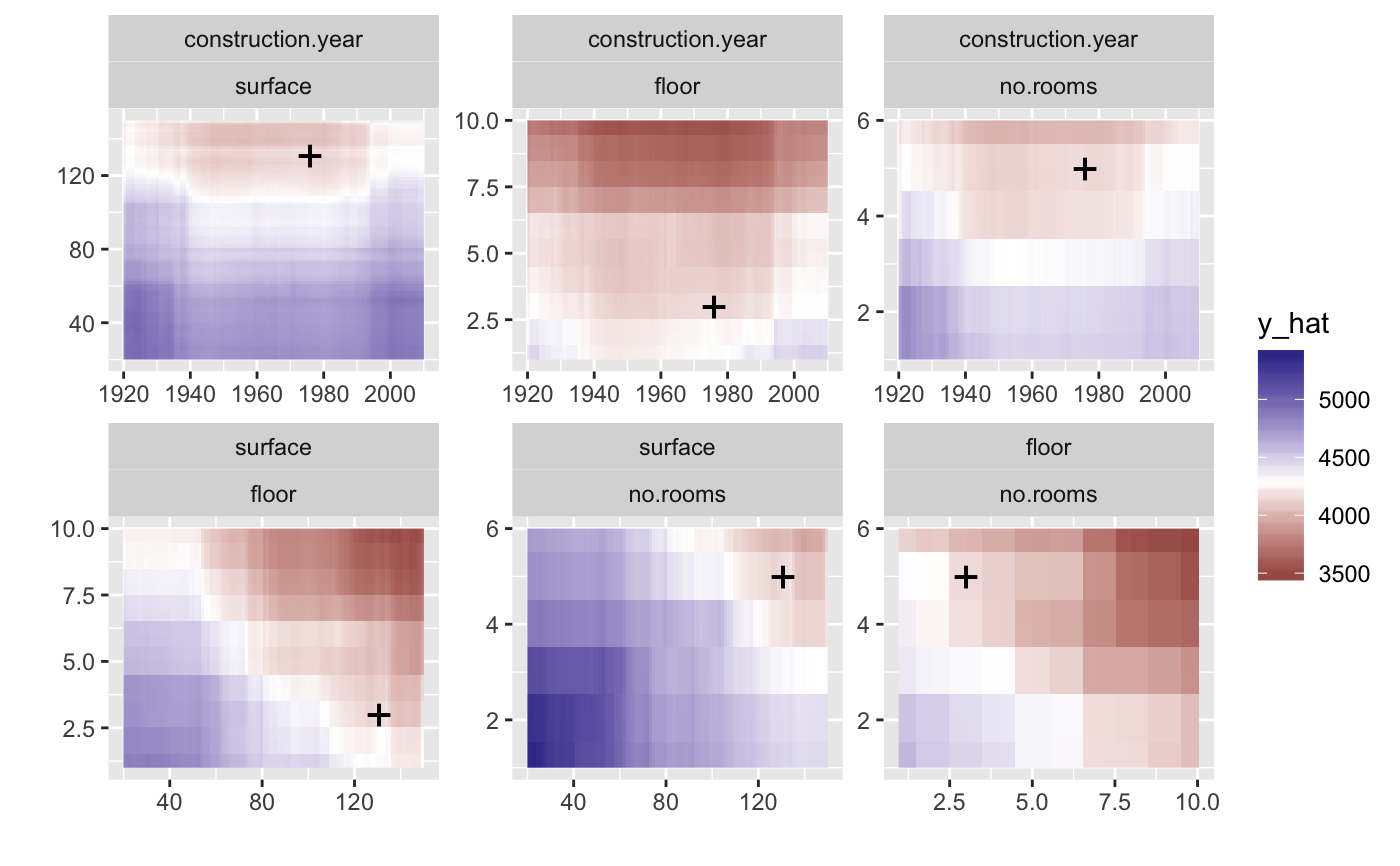
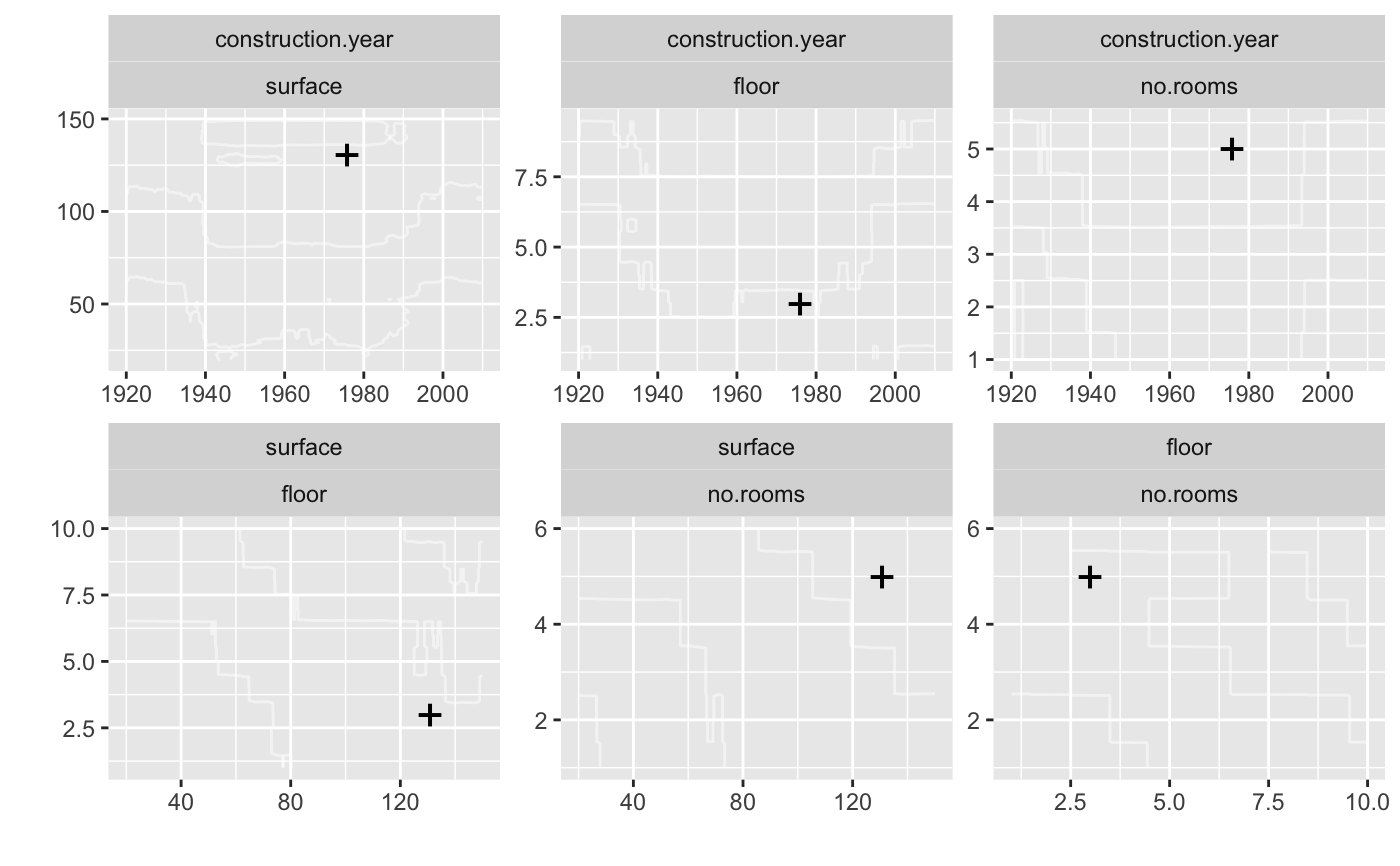
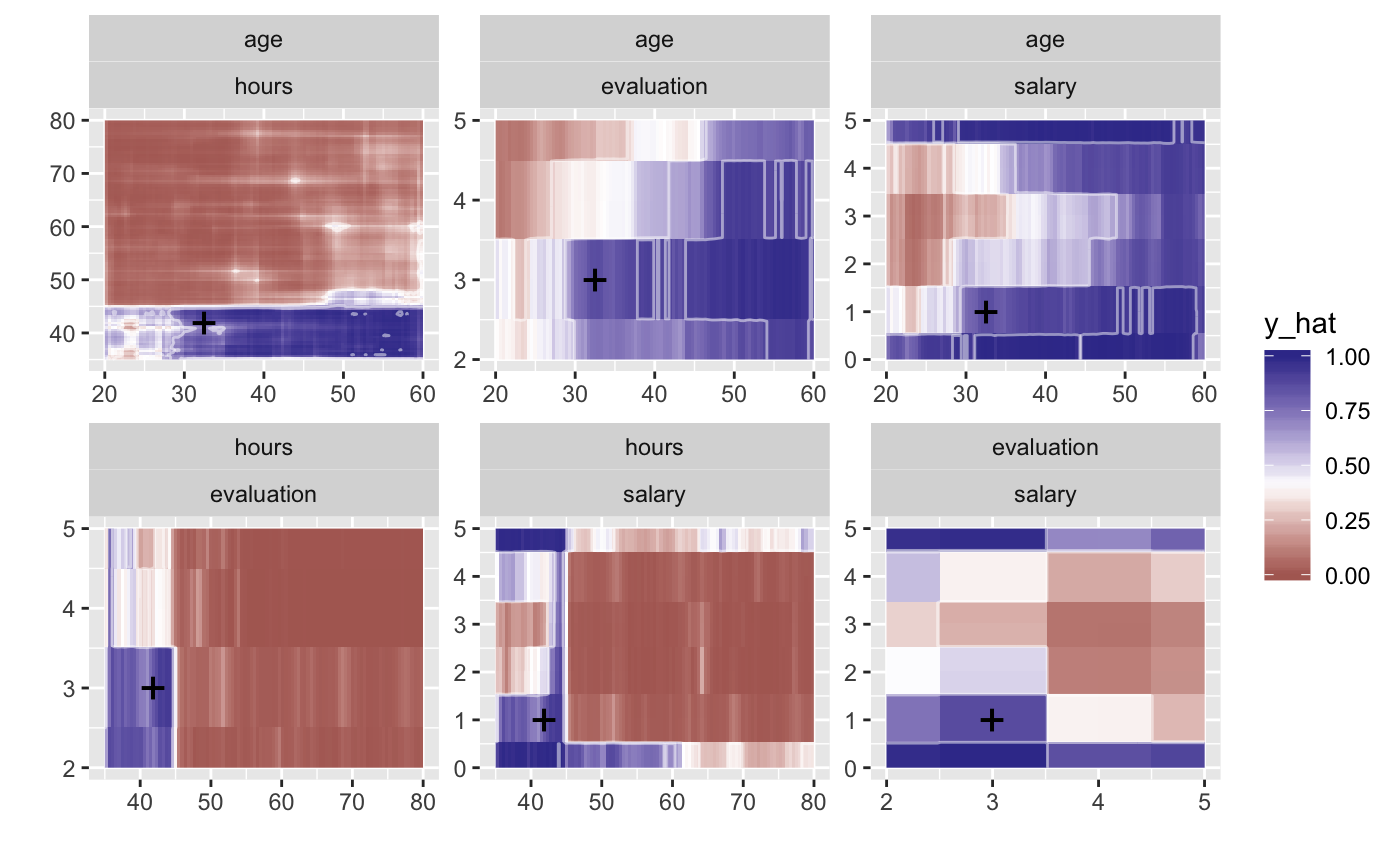
Examples
library("DALEX")library("randomForest") set.seed(59) apartments_rf_model <- randomForest(m2.price ~ construction.year + surface + floor + no.rooms + district, data = apartments) explainer_rf <- explain(apartments_rf_model, data = apartmentsTest[,2:6], y = apartmentsTest$m2.price) new_apartment <- apartmentsTest[1, ] new_apartment#> m2.price construction.year surface floor no.rooms district #> 1001 4644 1976 131 3 5 Srodmiescie#> y_hat new_x1 new_x2 vname1 vname2 label #> 1001 4899.536 1920 20.0 construction.year surface randomForest #> 1001.1 4896.920 1920 21.3 construction.year surface randomForest #> 1001.2 4900.060 1920 22.6 construction.year surface randomForest #> 1001.3 4900.187 1920 23.9 construction.year surface randomForest #> 1001.4 4901.809 1920 25.2 construction.year surface randomForest #> 1001.5 4896.952 1920 26.5 construction.year surface randomForestplot(wi_rf_2d)plot(wi_rf_2d, add_contour = FALSE)plot(wi_rf_2d, add_observation = FALSE)plot(wi_rf_2d, add_raster = FALSE)# HR data model <- randomForest(status ~ gender + age + hours + evaluation + salary, data = HR) pred1 <- function(m, x) predict(m, x, type = "prob")[,1] explainer_rf_fired <- explain(model, data = HR[,1:5], y = HR$status == "fired", predict_function = pred1, label = "fired") new_emp <- HR[1, ] new_emp#> gender age hours evaluation salary status #> 1 male 32.58267 41.88626 3 1 fired#> y_hat new_x1 new_x2 vname1 vname2 label #> 1 0.472 20.00389 35.00000 age hours fired #> 1.1 0.524 20.00389 35.44978 age hours fired #> 1.2 0.582 20.00389 35.89955 age hours fired #> 1.3 0.570 20.00389 36.34933 age hours fired #> 1.4 0.540 20.00389 36.79911 age hours fired #> 1.5 0.582 20.00389 37.24889 age hours firedplot(wi_rf_2d)