Plot What If Explanations
Function 'plot.what_if_explainer' plots What-If Plots for a single prediction / observation.
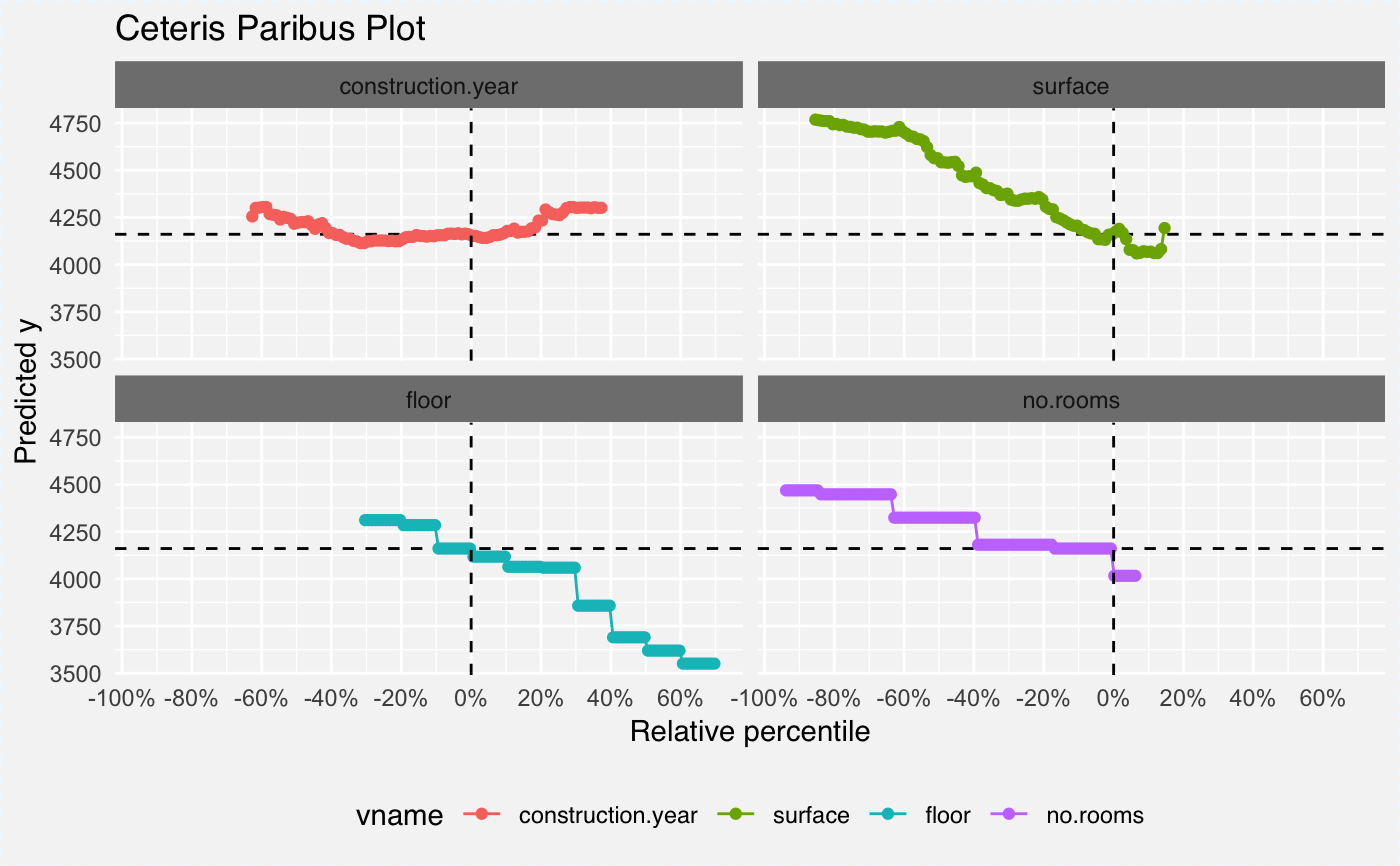
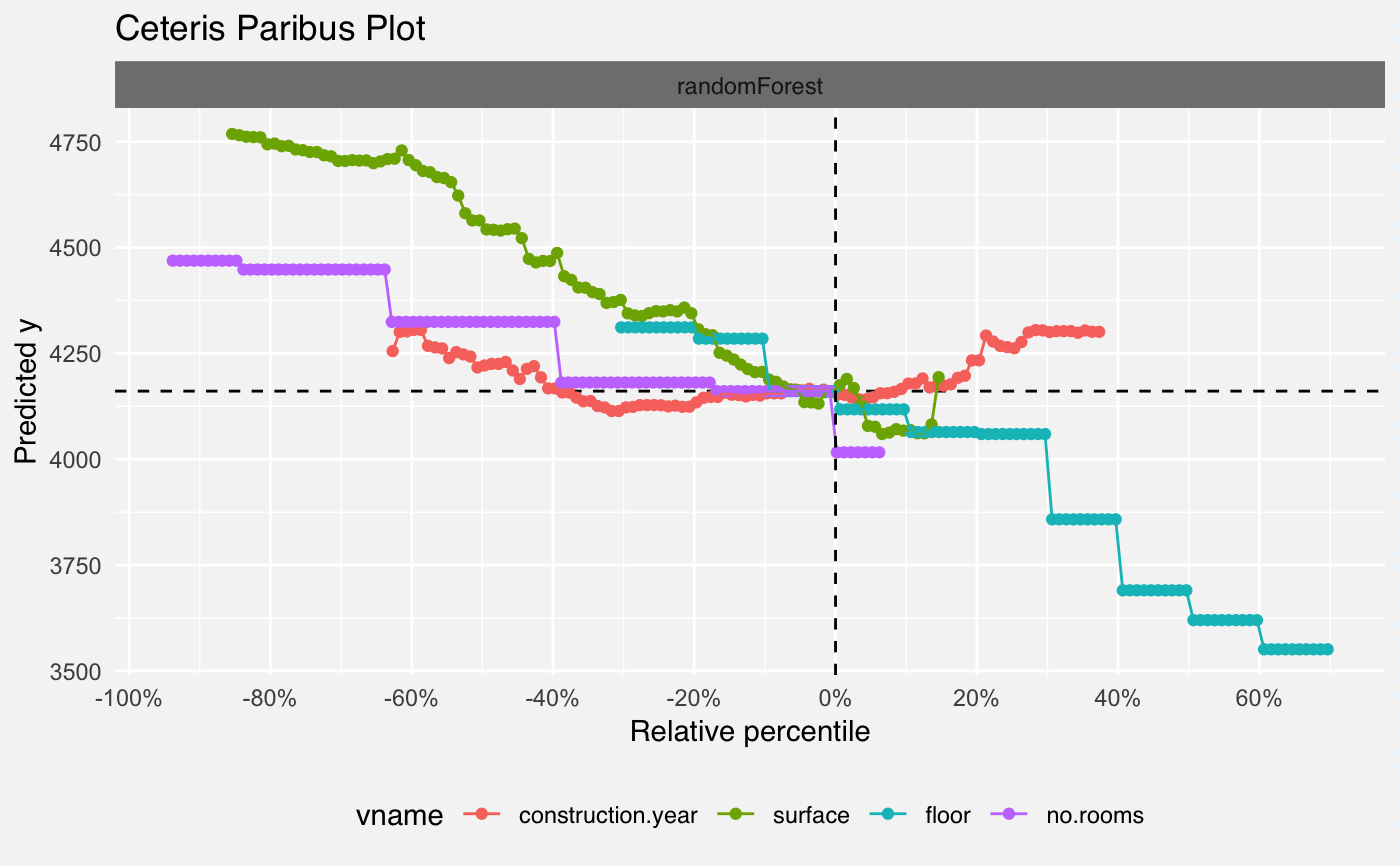
# S3 method for what_if_explainer
plot(x, ..., quantiles = TRUE,
  split = "models", split_ncol = NULL, color = "variables")
Arguments
| x | a ceteris paribus explainer produced with the 'what_if' function |
|---|---|
| ... | other explainers that shall be plotted together |
| quantiles | if TRUE (default) then quantiles will be presented on OX axis. If FALSE then original values will be presented on OX axis |
| split | a character, either 'models' or 'variables'. Sets the variable for faceting |
| split_ncol | number of columns for the 'facet_wrap' |
| color | a character, either 'models' or 'variables'. Sets the variable for coloring |
Value
a ggplot2 object
Examples
library("DALEX")library("randomForest") set.seed(59) apartments_rf_model <- randomForest(m2.price ~ construction.year + surface + floor + no.rooms + district, data = apartments) explainer_rf <- explain(apartments_rf_model, data = apartmentsTest[,2:6], y = apartmentsTest$m2.price) new_apartment <- apartmentsTest[1, ] new_apartment#> m2.price construction.year surface floor no.rooms district #> 1001 4644 1976 131 3 5 Srodmiescie#> y_hat new_x vname x_quant quant relative_quant #> 1001 4255.354 1920 construction.year 0.6268889 0.00 -0.6268889 #> 1001.1 4300.702 1921 construction.year 0.6268889 0.01 -0.6168889 #> 1001.2 4301.926 1922 construction.year 0.6268889 0.02 -0.6068889 #> 1001.3 4305.352 1923 construction.year 0.6268889 0.03 -0.5968889 #> 1001.4 4305.352 1923 construction.year 0.6268889 0.04 -0.5868889 #> 1001.5 4267.723 1924 construction.year 0.6268889 0.05 -0.5768889 #> label #> 1001 randomForest #> 1001.1 randomForest #> 1001.2 randomForest #> 1001.3 randomForest #> 1001.4 randomForest #> 1001.5 randomForestplot(wi_rf, split = "variables", color = "variables")plot(wi_rf)