breakDown plots for the linear models
Przemyslaw Biecek
2019-03-27
break_lm.RmdHere we will use the wine quality data (https://archive.ics.uci.edu/ml/machine-learning-databases/wine-quality/winequality-white.csv) to present the breakDown package for lm models.
First, let’s download the data from URL
url <- 'https://archive.ics.uci.edu/ml/machine-learning-databases/wine-quality/winequality-white.csv'
wine <- read.table(url, header = T, sep=";")
head(wine, 3)
#>   fixed.acidity volatile.acidity citric.acid residual.sugar chlorides
#> 1           7.0             0.27        0.36           20.7     0.045
#> 2           6.3             0.30        0.34            1.6     0.049
#> 3           8.1             0.28        0.40            6.9     0.050
#>   free.sulfur.dioxide total.sulfur.dioxide density   pH sulphates alcohol
#> 1                  45                  170  1.0010 3.00      0.45     8.8
#> 2                  14                  132  0.9940 3.30      0.49     9.5
#> 3                  30                   97  0.9951 3.26      0.44    10.1
#>   quality
#> 1       6
#> 2       6
#> 3       6
Now let’s create a liner model for quality.
model <- lm(quality ~ fixed.acidity + volatile.acidity + citric.acid + residual.sugar + chlorides + free.sulfur.dioxide + total.sulfur.dioxide + density + pH + sulphates + alcohol,
               data = wine)
The common goodness-of-fit parameteres for lm model are R^2, adjusted R^2, AIC or BIC coefficients.
summary(model)$r.squared
#> [1] 0.2818704
summary(model)$adj.r.squared
#> [1] 0.2802536
BIC(model)
#> [1] 11197.94
They assess the overall quality of fit. But how to understand the factors that drive predictions for a single observation?
With the breakDown package!
library(breakDown)
library(ggplot2)

new_observation <- wine[1,]
br <- broken(model, new_observation)
br
#>                            contribution
#> (Intercept)                       5.878
#> residual.sugar = 20.7             1.166
#> density = 1.001                  -1.048
#> alcohol = 8.8                    -0.332
#> pH = 3                           -0.129
#> free.sulfur.dioxide = 45          0.036
#> sulphates = 0.45                 -0.025
#> volatile.acidity = 0.27           0.015
#> fixed.acidity = 7                 0.010
#> total.sulfur.dioxide = 170       -0.009
#> citric.acid = 0.36                0.001
#> chlorides = 0.045                 0.000
#> final_prognosis                   5.563
#> baseline:  0
# different roundings
print(br, digits = 2, rounding_function = signif)
#>                            contribution
#> (Intercept)                     5.90000
#> residual.sugar = 20.7           1.20000
#> density = 1.001                -1.00000
#> alcohol = 8.8                  -0.33000
#> pH = 3                         -0.13000
#> free.sulfur.dioxide = 45        0.03600
#> sulphates = 0.45               -0.02500
#> volatile.acidity = 0.27         0.01500
#> fixed.acidity = 7               0.00950
#> total.sulfur.dioxide = 170     -0.00900
#> citric.acid = 0.36              0.00057
#> chlorides = 0.045               0.00019
#> final_prognosis                 5.60000
#> baseline:  0
print(br, digits = 6, rounding_function = round)
#>                            contribution
#> (Intercept)                    5.877909
#> residual.sugar = 20.7          1.165904
#> density = 1.001               -1.047875
#> alcohol = 8.8                 -0.331669
#> pH = 3                        -0.129216
#> free.sulfur.dioxide = 45       0.036178
#> sulphates = 0.45              -0.025162
#> volatile.acidity = 0.27        0.015355
#> fixed.acidity = 7              0.009514
#> total.sulfur.dioxide = 170    -0.009041
#> citric.acid = 0.36             0.000570
#> chlorides = 0.045              0.000191
#> final_prognosis                5.562658
#> baseline:  0
plot(br) + ggtitle("breakDown plot for predicted quality of a wine")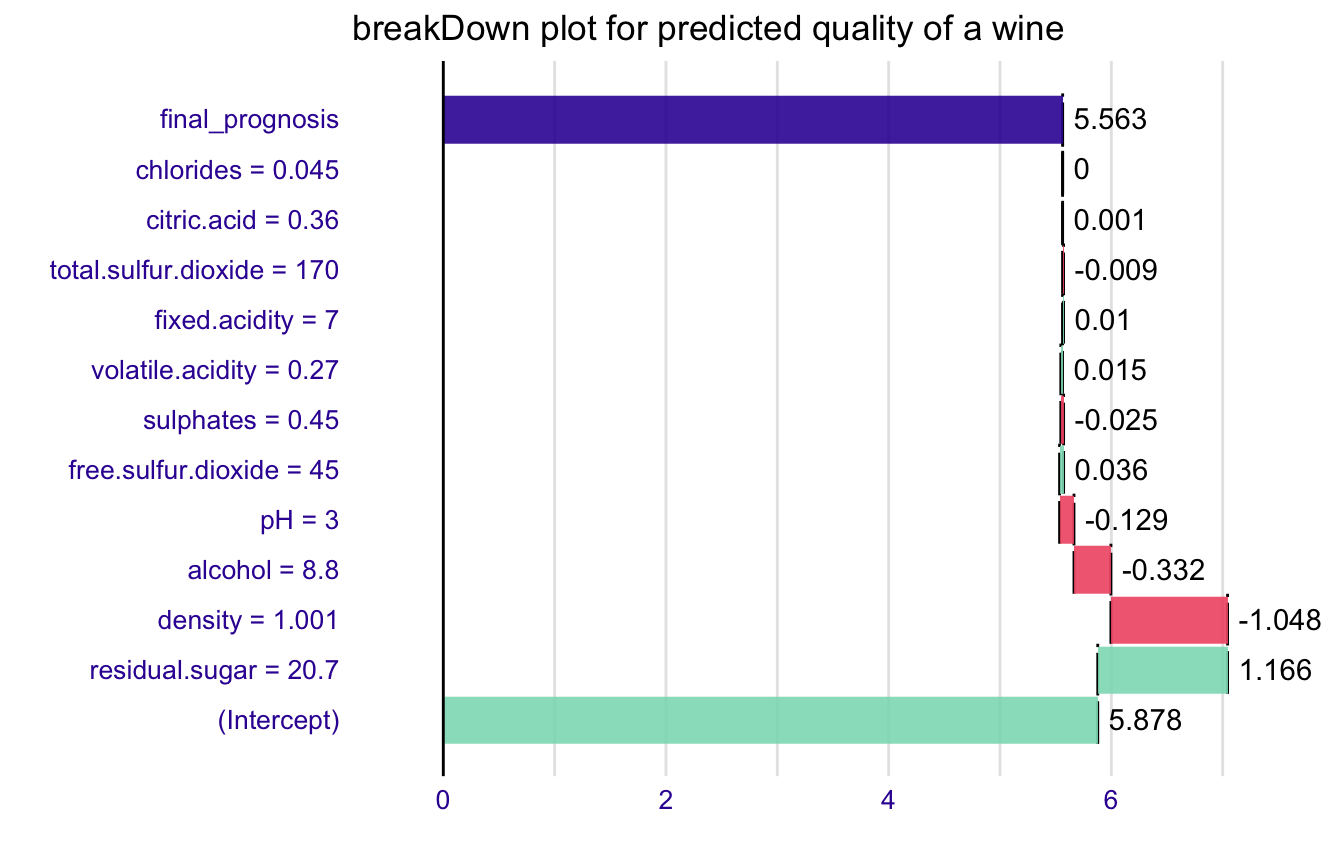
Use the baseline argument to set the origin of plots.
br <- broken(model, new_observation, baseline = "Intercept")
br
#>                            contribution
#> residual.sugar = 20.7             1.166
#> density = 1.001                  -1.048
#> alcohol = 8.8                    -0.332
#> pH = 3                           -0.129
#> free.sulfur.dioxide = 45          0.036
#> sulphates = 0.45                 -0.025
#> volatile.acidity = 0.27           0.015
#> fixed.acidity = 7                 0.010
#> total.sulfur.dioxide = 170       -0.009
#> citric.acid = 0.36                0.001
#> chlorides = 0.045                 0.000
#> final_prognosis                  -0.315
#> baseline:  5.877909
plot(br) + ggtitle("breakDown plot for predicted quality of a wine")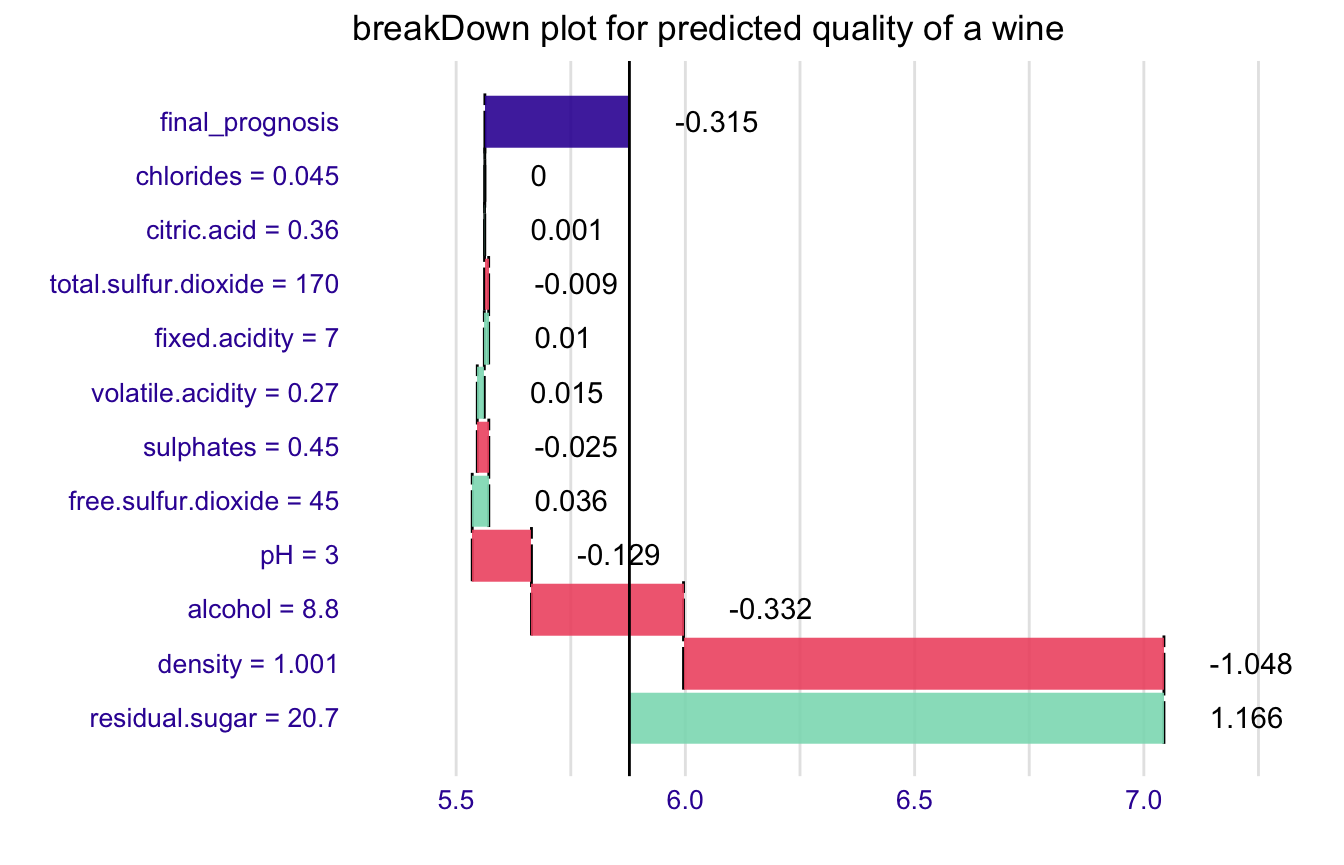
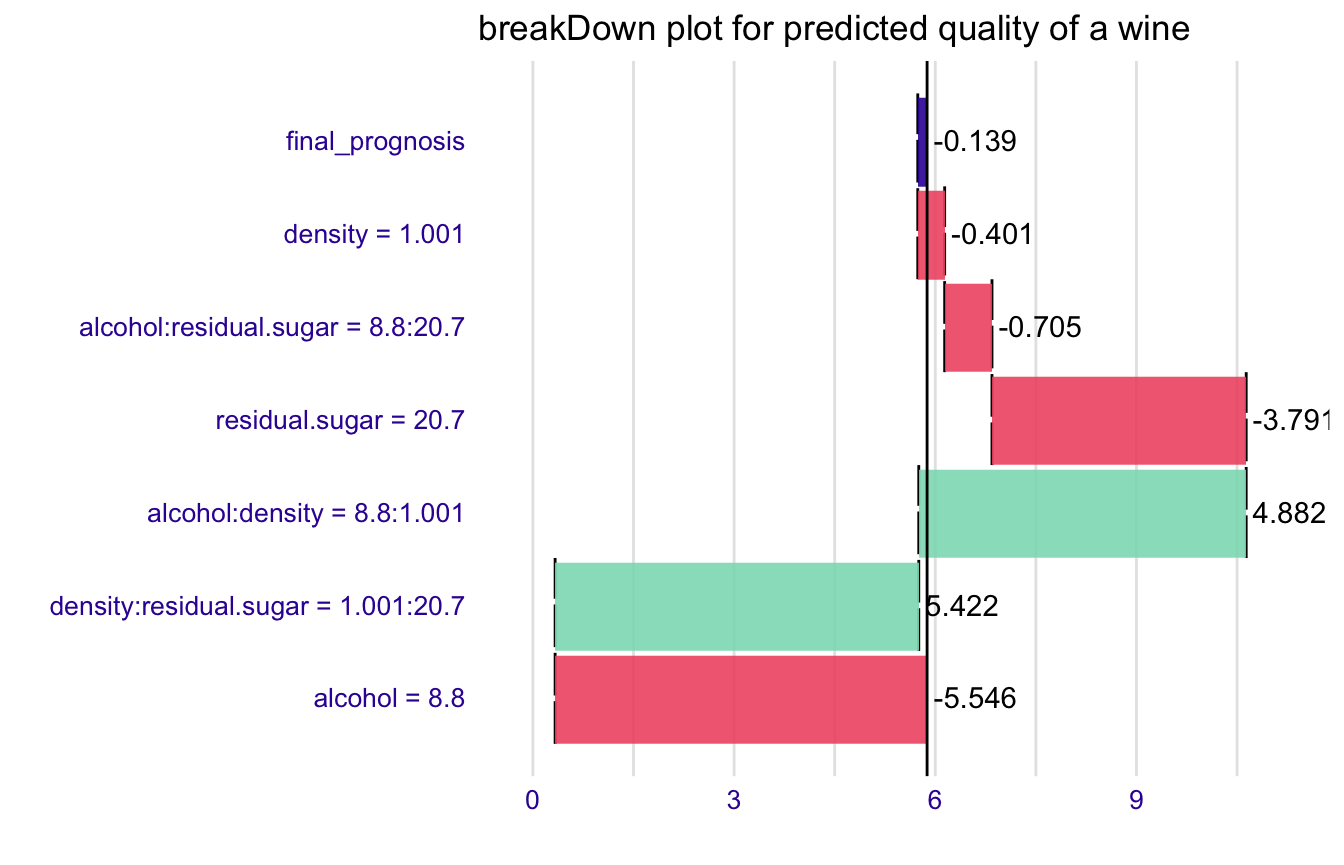
Works for interactions as well
model <- lm(quality ~ (alcohol + density  + residual.sugar)^2,
               data = wine)
new_observation <- wine[1,]

br <- broken(model, new_observation, baseline = "Intercept")
br
#>                                     contribution
#> alcohol = 8.8                             -5.546
#> density:residual.sugar = 1.001:20.7        5.422
#> alcohol:density = 8.8:1.001                4.882
#> residual.sugar = 20.7                     -3.791
#> alcohol:residual.sugar = 8.8:20.7         -0.705
#> density = 1.001                           -0.401
#> final_prognosis                           -0.139
#> baseline:  5.877909
plot(br) + ggtitle("breakDown plot for predicted quality of a wine")