Model Agnostic Approach to Breaking Down of Model Predictions
This function implements two greedy strategies for decompositions of model predictions (see the direction parameter).
Both stategies are model agnostic, they are greedy but in most cases they give very similar results.
Find more information about these strategies in https://arxiv.org/abs/1804.01955.
# S3 method for default
broken(model, new_observation, data, direction = "up",
  ..., baseline = 0, keep_distributions = FALSE,
  predict.function = predict)
Arguments
| model | a model, it can be any predictive model, find examples for most popular frameworks in vigniettes |
|---|---|
| new_observation | a new observation with columns that corresponds to variables used in the model |
| data | the original data used for model fitting, should have same collumns as the 'new_observation'. |
| direction | either 'up' or 'down' determined the exploration strategy |
| ... | other parameters |
| baseline | the orgin/baseline for the breakDown plots, where the rectangles start. It may be a number or a character "Intercept". In the latter case the orgin will be set to model intercept. |
| keep_distributions | if TRUE, then the distribution of partial predictions is stored in addition to the average. |
| predict.function | function that will calculate predictions out of model. It shall return a single numeric value per observation. For classification it may be a probability of the default class. |
Value
an object of the broken class
Examples
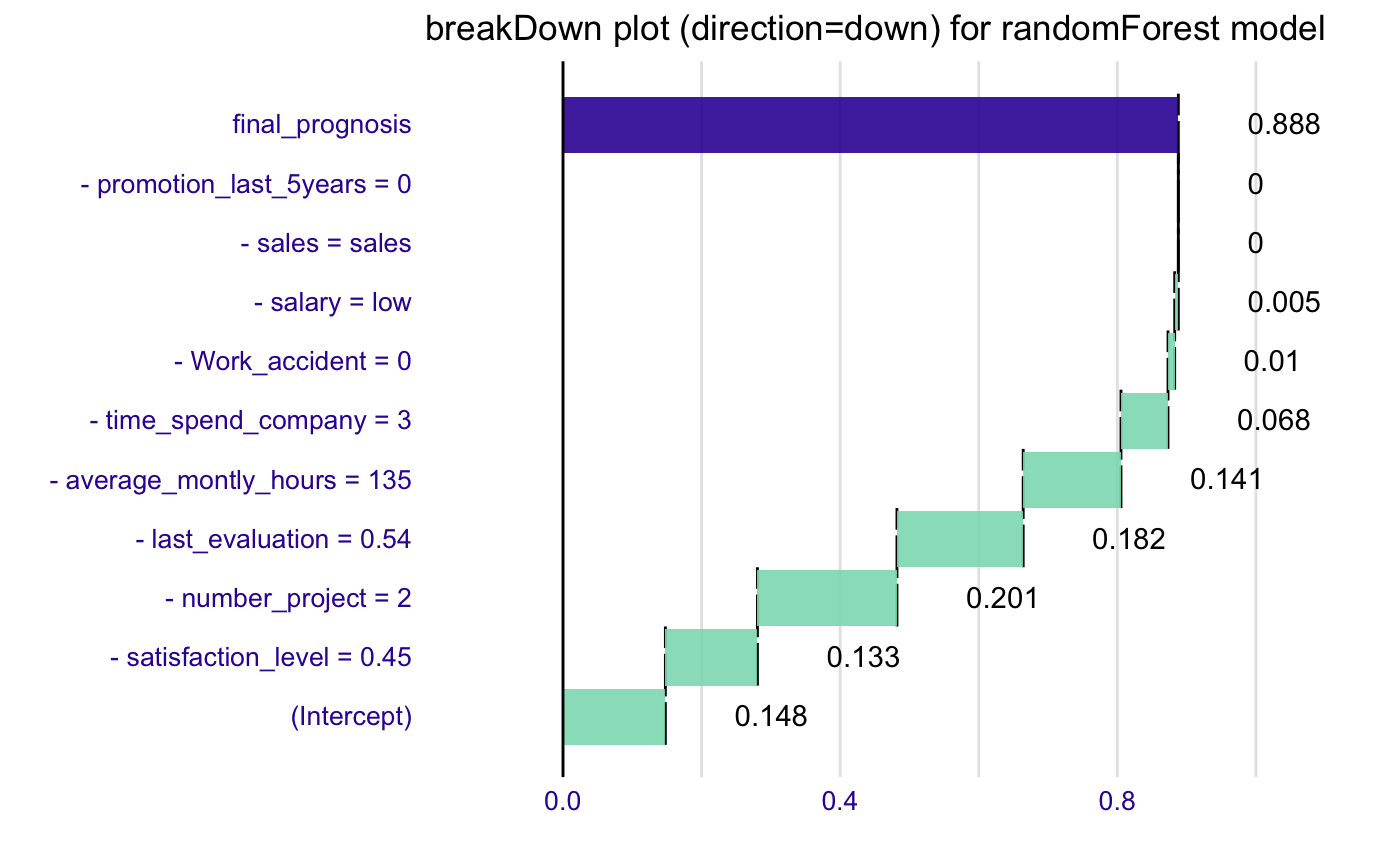
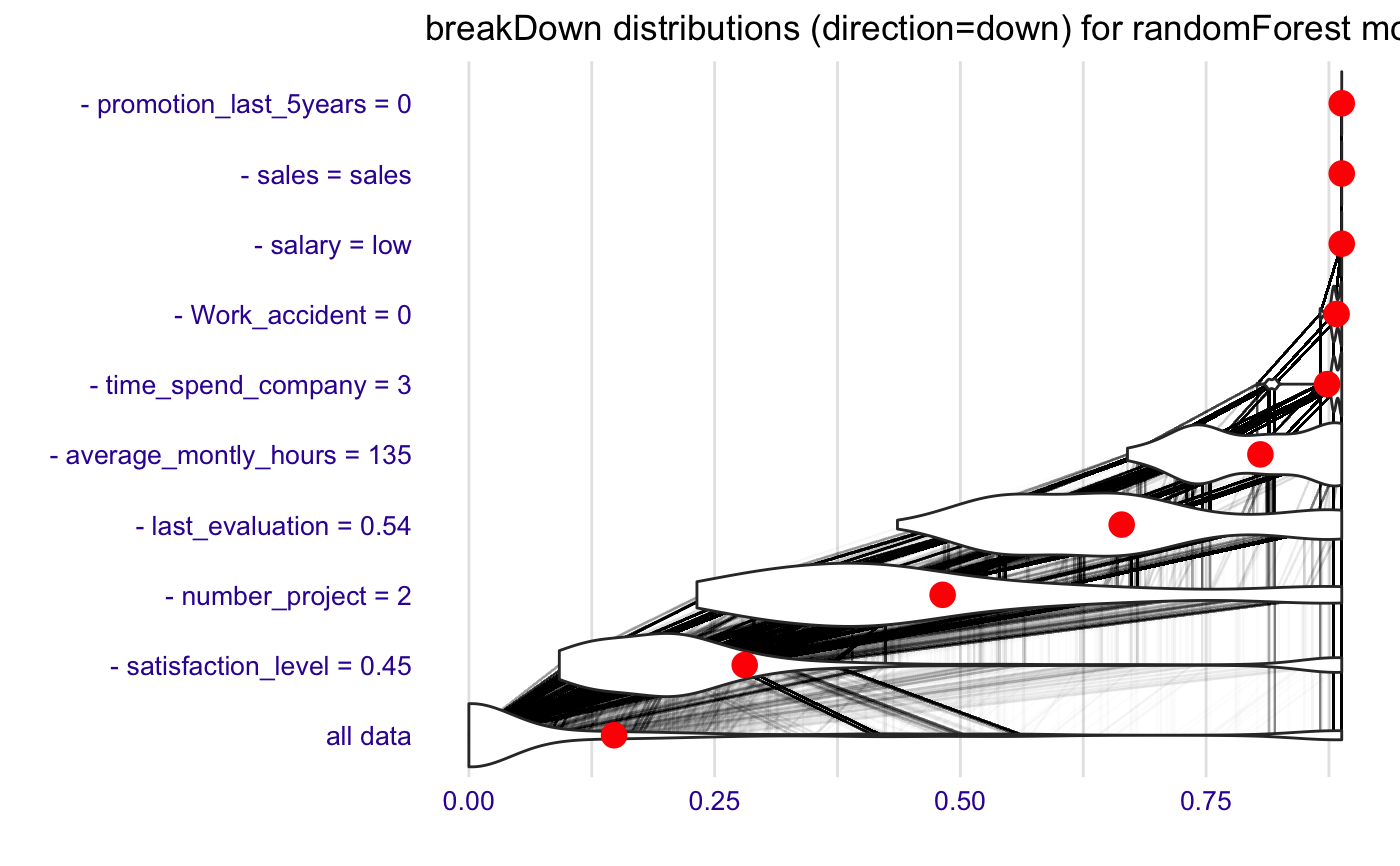
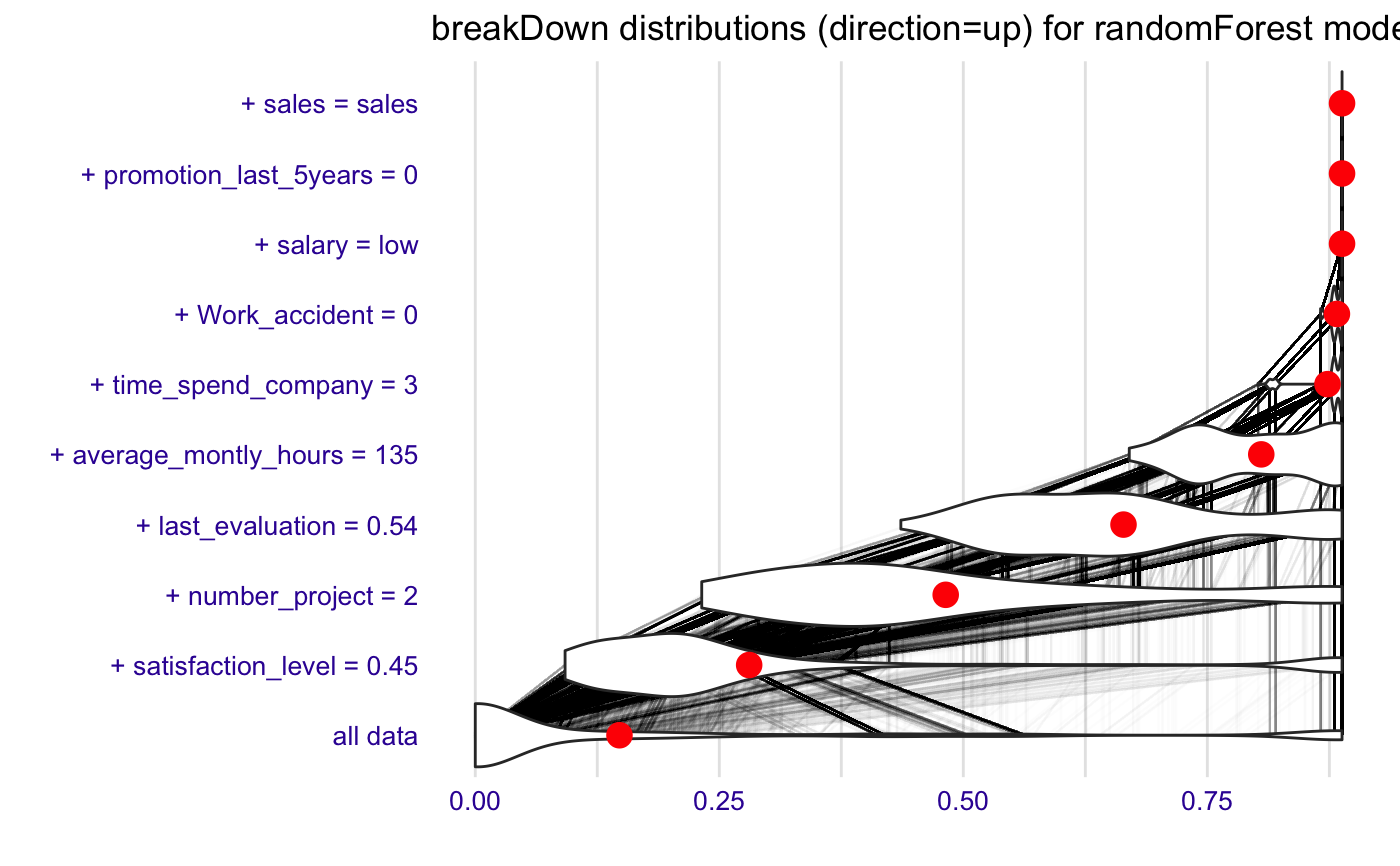
library("breakDown") library("randomForest") library("ggplot2") set.seed(1313) model <- randomForest(factor(left)~., data = HR_data, family = "binomial", maxnodes = 5) predict.function <- function(model, new_observation) predict(model, new_observation, type="prob")[,2] predict.function(model, HR_data[11,-7])#> [1] 0.888explain_1 <- broken(model, HR_data[11,-7], data = HR_data[,-7], predict.function = predict.function, direction = "down") explain_1#> contribution #> (Intercept) 0.148 #> - satisfaction_level = 0.45 0.133 #> - number_project = 2 0.201 #> - last_evaluation = 0.54 0.182 #> - average_montly_hours = 135 0.141 #> - time_spend_company = 3 0.068 #> - Work_accident = 0 0.010 #> - salary = low 0.005 #> - sales = sales 0.000 #> - promotion_last_5years = 0 0.000 #> final_prognosis 0.888 #> baseline: 0explain_2 <- broken(model, HR_data[11,-7], data = HR_data[,-7], predict.function = predict.function, direction = "down", keep_distributions = TRUE) plot(explain_2, plot_distributions = TRUE) + ggtitle("breakDown distributions (direction=down) for randomForest model")explain_3 <- broken(model, HR_data[11,-7], data = HR_data[,-7], predict.function = predict.function, direction = "up", keep_distributions = TRUE) plot(explain_3, plot_distributions = TRUE) + ggtitle("breakDown distributions (direction=up) for randomForest model")


