1.1 Data science, or why we should learn R
Data science is a dynamically growing discipline which combines data analysis and programming. There is an ever-increasing need for people who can analyse newly emerging data streams. In order to keep pace with the contemporary digital tsunami, we need robust tools to analyse data. One of such tools is the R language.
There are numerous programming languages, but R allows you to analyse data much quicker than any other language. You can go to http://bit.ly/2fXfWV2 (Video Introduction to R by Microsoft) to see a 90-second video which presents the potential of R software.
Why? R was created to facilitate working with data. The R language is a dialect of the S language developed by John Chambers from Bell Labs around 1976. The S language was developed for interactive data analysis. Numerous solutions were introduced to it to simplify data processing.
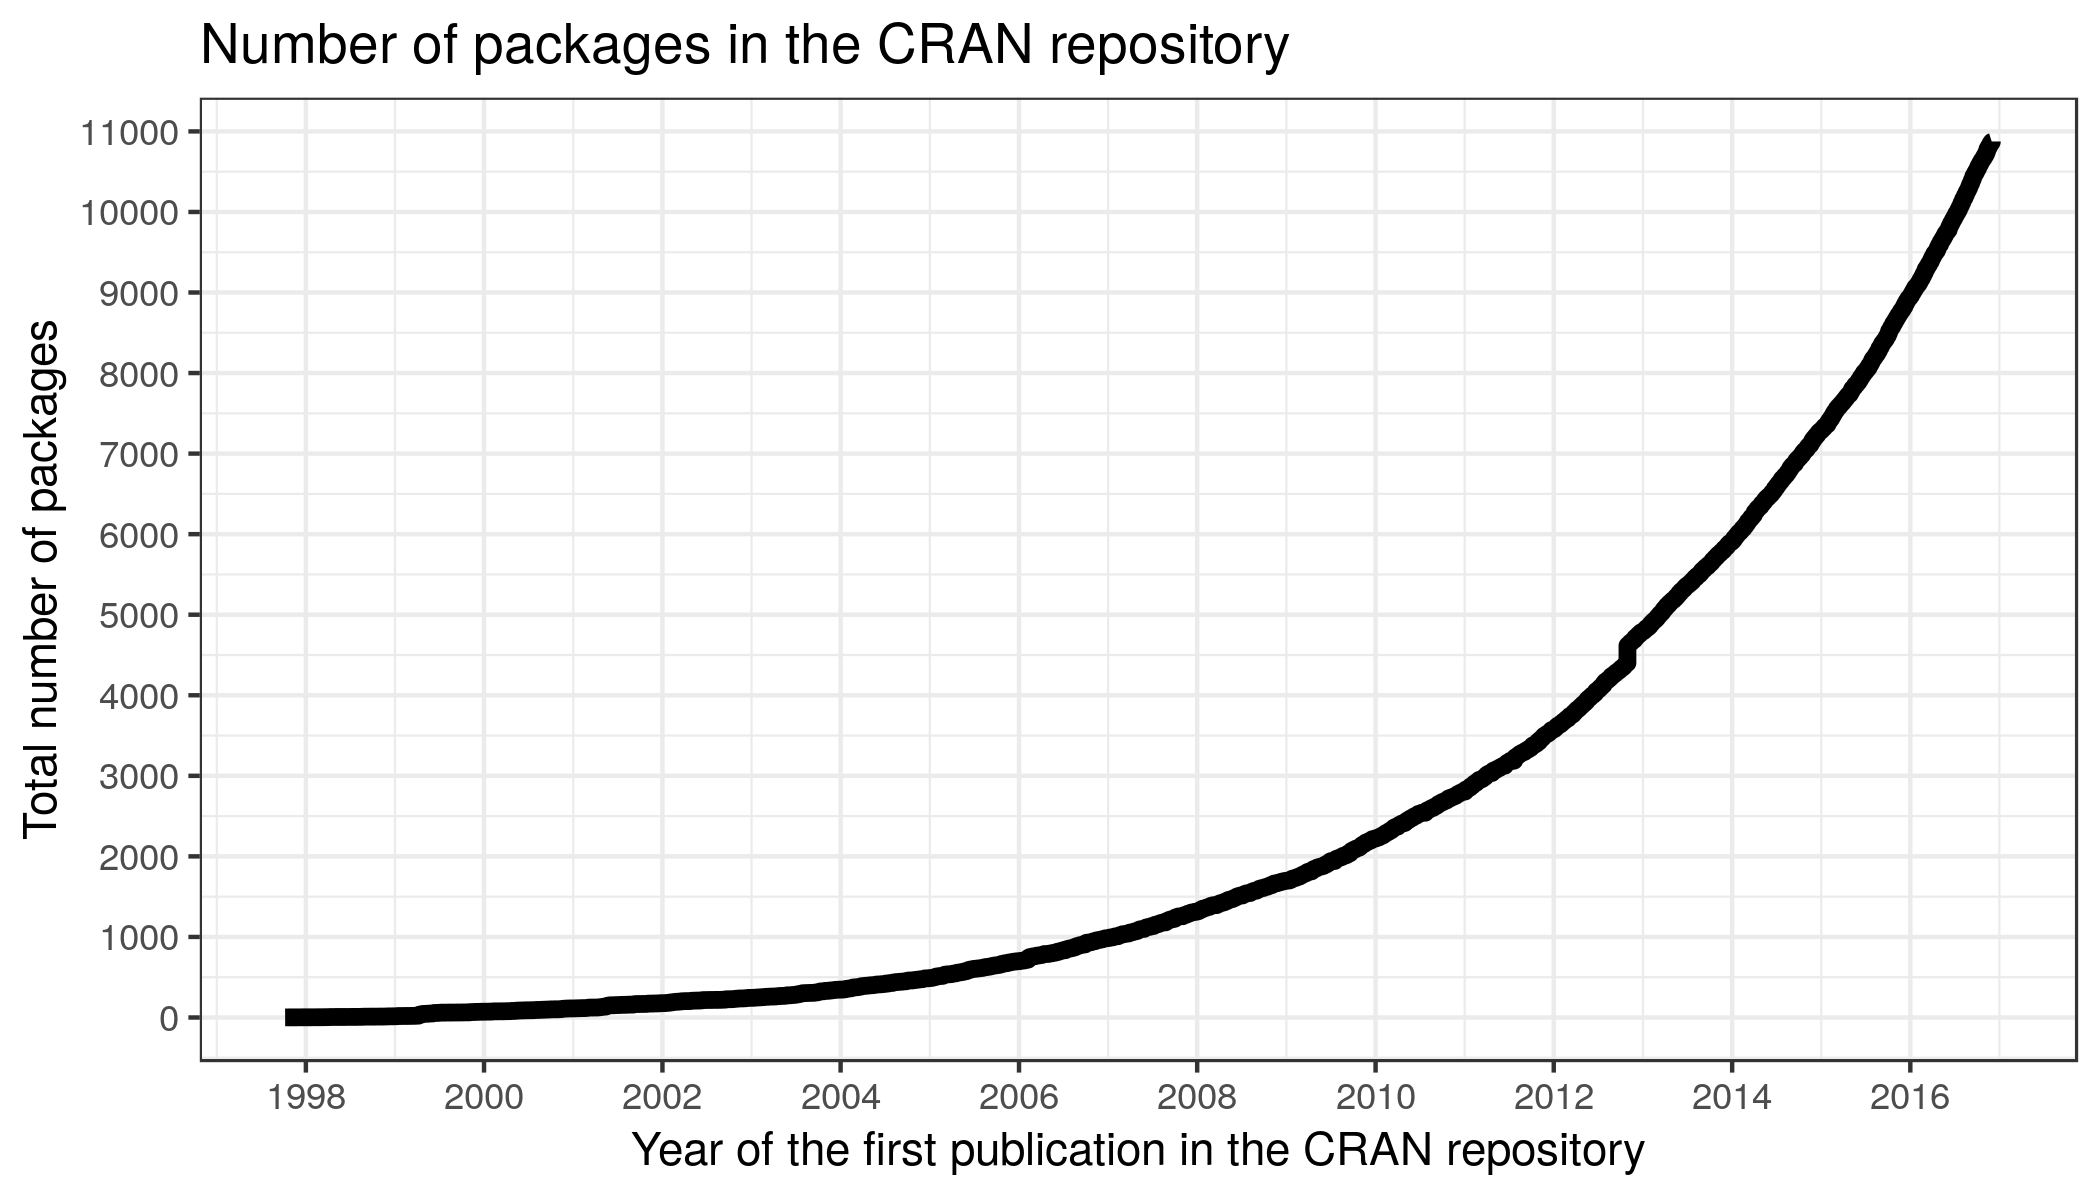
The first version of R was developed in 1991 by Robert Gentleman and Ross Ihaka (also known as R&R) who worked in the Department of Statistics at the University of Auckland. Initially, the R package was meant as a teaching resource at that university. At the same time, it was an open project, which is why it quickly gained in popularity. Since 1997, over twenty people worked on the development of R, thus constituting the so-called core team. The team comprises experts from various fields (statistics, mathematics, numerical methods, and computer science in a broad sense) from all over the world. The number of people developing R grew quickly. Today, the project is developed by “The Foundation for Statistical Computing” that has hundreds of members. Apart from that, there are thousands of people all around the world who share their own packages with various functions. The number of R libraries grows rapidly. In 2016, there were over 10,000 packages in the main CRAN repository (see Figure 1.1). Apart from that, there are thousands of packages that are private or placed in other repositories.
Figure 1.1: Number of R packages in the cran repository, as of November 2016.
R is a GNU project based on the GNU GPL license, which means it is free of charge for both educational and commercial use. More information about GNU GPL can be found at [53]. The R platform has excellent documentation available as PDF files or HTML pages. The documentation is mostly in English, but some files have other language versions as well.
The R language has been developed for people dealing with data from the very beginning. This is why it was frequently treated as a domain-specific language (DSL) by many computer scientists rather than a full-featured language. As time went by, however, the capabilities of R expanded and more solutions outside the field of data analysis appeared. Today, R is one of the most popular programming languages.
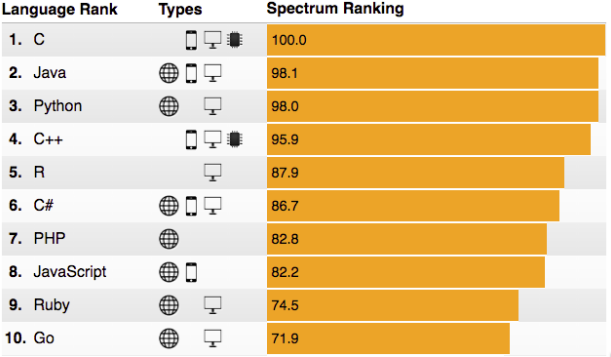
One evidence of this is the ranking created based on the votes by the IEEE committee members (Institute of Electrical and Electronics Engineer). In 2016, R ranked as the fifth most popular language, outrunning such languages as PHP or JavaScript.
Figure 1.2: IEEE ranking on language popularity in 2016.
There are multiple reasons behind the popularity of R. Below, we present those we consider the most significant ones.
Because of its elasticity, R is nowadays the most basic language used when teaching statistics and data analysis, present at practically any good university.
R software allows us to create and share packages that contain new functions. Currently, there are over 10,000 packages for multiple purposes, such as rgl – for 3D graphics, lima – for microarray data analysis, seqinr – for genomics data analysis, psy – with statistical functions commonly used in psychometry, geoR – with geostatistical functions, Sweave – for report generation using LaTeX, and many others. Everyone can create and share their own packages.
The R software allows us to use functions written in other languages (C, C++, Fortran). What is more, we can execute functions available in R from other languages (Java, C, C++, Statistica packages, SAS, and many others). Thanks to that, we can write most of our application in Java, and use R as a big external library with statistical functions.
R software facilitates creating high-quality plots, which is of vital importance when presenting results. Even with their default settings, those plots look much better than their counterparts in other packages.
More about the history and development of R can be found at http://bit.ly/2domniT (“R Programming” at https://www.coursera.org/).